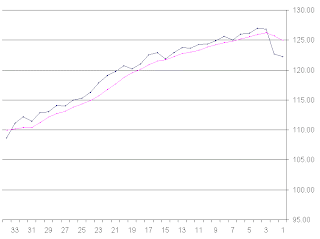
Anyway here is the DIA on the weekly basis and its relationship with its pivot point average.

The last crossing going up in my method was 33 weeks ago and that is one long time in the world of markets. After you are about 15 weeks or so into it you have a good sum of profits and so the various feints to the line don't scare you as much as they would earlier.
But notice how the angle of the line changed in recent weeks as it started to flatten out.
But the key point to notice is that we are not quite out of the woods yet as far as this correction is concerned and it could go on for some time yet into the future.

1 comment:
Its not nice to be lost in the woods.
Post a Comment