Last day of the month (not Friday as I said last week). Last day is usually pretty mild and moderate and this one is about right. I'm taking another day off and will be back to trading tomorrow - maybe.
Still holding INTC but that's all folks.
Update - saw the VIX turn around and I went fishing. Found ACI and rode it for a nice gain. Finally decided to sell INTC. No use in holding it - I can buy it back again if it starts to ascend.
Currently I am absolutely flat and that is probably a good way to be to start August.
A lot of pressure came off the VIX today - went from being 10 points under to only 6. Also lost some pressure from the up/down ratio - it returned to a neutral setting. The new 20 day highs still remain above 500 so that might mean a little rocky start to August.
We'll see.
Monday, July 31, 2006
The Rules
I have to revisit this subject every now and then more for myself than for anyone else. Rule 1 - nobody knows nothing - including me. Rule 2 - when in doubt trust your instincts - if it feels wrong it is wrong and no amount of hoping can make it right.
Rule 2 of course is the corollary to rule 1 and the whole package means be true to yourself.
If you follow those two rules in life as well as in investing you will probably come out OK.
Rule 2 of course is the corollary to rule 1 and the whole package means be true to yourself.
If you follow those two rules in life as well as in investing you will probably come out OK.
Sunday, July 30, 2006
EMA 90 What A Tight Rope
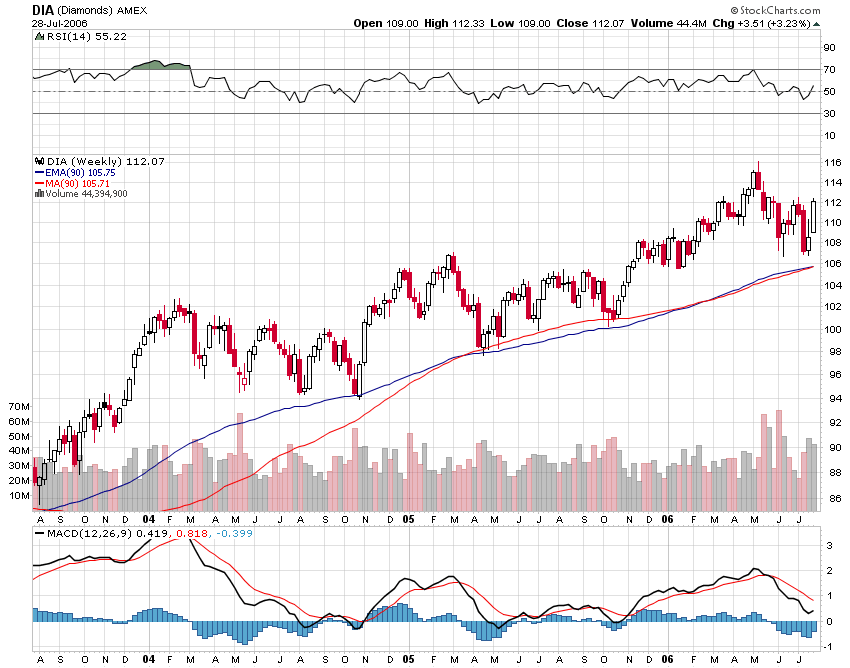
Many traders myself included use the simple moving average which is probably a mistake. Here is a figure of the DIA with both the SMA 90 and the EMA 90 overlaid. Note how the DIA has been on the 90 day EMA and only recently the 90 SMA joined the mix.
The lesson - sometimes the SMA tells the story but the EMA always tells the story.
The second lesson, of course, is that the DIA (and INDU you can look it up) seems to use the 90 day EMA as a support area.
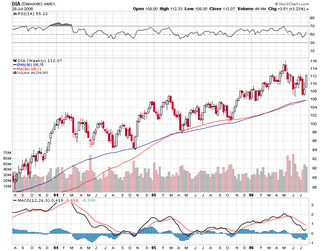
The figure comes from Stockcharts.com. A super site for very sophisticated charting software. If you don't use the site you are foolish.
The lesson - sometimes the SMA tells the story but the EMA always tells the story.
The second lesson, of course, is that the DIA (and INDU you can look it up) seems to use the 90 day EMA as a support area.
The figure comes from Stockcharts.com. A super site for very sophisticated charting software. If you don't use the site you are foolish.
Saturday, July 29, 2006
20 High 20 Low
I did some analysis of close at 20 day high vs close at 20 day low and found some interesting things. First bottoms are generally indicated by high numbers of 20 day lows vs low numbers of 20 day highs. And, conversely, tops are suggested by the opposite configuration. Which makes sense. When the market hits extremes in either direction it reverses.
What I saw is that after several days of high numbers for either axis (i.e. anything in excess of 500) the market starts going in the other direction. It doesn't generally happen overnight because I think it takes a little while for the trading community at large to catch on to the "new" fact of the market. What is the "new" fact of the market? When there are lots of stocks hitting an intermediate bottom, i.e. the 20-day low, then there are lots of buying opportunities. Obviously the more buying opportunities there are the more buying that will take place and vice versa.
The last 4 days have seen 594, 584, 380 and 836 20-day highs respectively. That would suggest that there are lots of stocks ready to be sold. It wouldn't surprise me at all to see a market decline next week.
Friday, July 28, 2006
One That Got Away - VSEA
This is the one I mentioned earlier that I mistakenly sold instead of adding to the position. I know, I know it's a lot of money and you should be 100% on the job. Unfortunately I was thinking about 3 other positions at the time and not paying much attention to what I was doing. This morning was a gold-mine of opportunities just waiting for the digging.
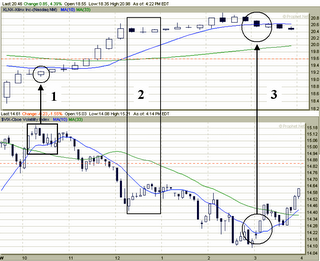
Anyway it was a gap-up (1) that I found using prophet.net software at 9:45 this morning. I watched it for another 15 minutes and once it formed the hammer above the opening bar I said this is probably for real. At 10:15 I took the trade (2) and about 15 minutes later I was going to double up because I saw the VIX starting to collapse. Oh well. Had I kept the trade I would have off-loaded around noon (3) right after that black candle.

Anyway it was a gap-up (1) that I found using prophet.net software at 9:45 this morning. I watched it for another 15 minutes and once it formed the hammer above the opening bar I said this is probably for real. At 10:15 I took the trade (2) and about 15 minutes later I was going to double up because I saw the VIX starting to collapse. Oh well. Had I kept the trade I would have off-loaded around noon (3) right after that black candle.

Friday
Boy did I ever screw-up. I grabbed some VSEA at 29.80 and when trying to add to it at 30.10 sold it instead and then didn't check until later. Later, after it crossed $31.00 that is. What a maroon. Don't know why I was so distracted but as they say crap happens and I'm just happy I made a couple of bucks anyway. No sense in crying over spilled milk.
Still holding INTC although it has reached my target. I'll hang on for awhile longer and see where it goes.
Sold TGB and am passing on the gold miners for awhile. I don't like the way they are behaving and would rather not hold any just for a couple of cents of appreciation. Better off keeping my funds ready for a better score on Monday.
Maybe Monday I'll be ready to concentrate better. I'll post the chart on VSEA later and you will see what I found appealing.
Thursday
Well I take off to play some golf and look what happens market sells off. Friday doesn't look too good either so I might take the day off again.
It's the last day of the month and that is generally benign. The Up/Down is 35%, the VIX is still 10% below its 10-day average and a new factor, the percentage of stocks making 20 day highs vs 20 day lows, is 68%. Taken together these three factors point to a rough several days ahead (although not necessarily Friday).
On the plus side is the fact that the three sisters (Q's, DIA, SPY) all printed strong white candles in the last hour. While that only works about 80% of the time it might be an overriding factor.
My PXE position was stopped out for a profit. I'm still holding INTC and EZM but today I'm dumping EZM and picking up TGB. EZM is a non-performer. I'll reacquire oil for the weekend.
Thursday, July 27, 2006
Riding the VIX Part 2
Another good example of how to use the VIX to key a trade.
Reference the figure.
1. On 7 26 2006 around 10:20 the VIX printed a topping formation. XLNX was already ascending but the 10 o'clock formation (a gravestone doji) suggested some uncertainty and perhaps even a reversal. But with the VIX topping it printed a hammer which indicates a continuation up.
2. Things begin to calm down in the noon hour and you can see that after throwing off a hanging man (reversal signal) at 12:15 the VIX then printed a hammer of its own. Note that XLNX reacted strongly to that with a black candle but that was a spinning top (uncertainty) so the trade could be kept until some confirmation appeared. This was followed by a another doji (uncertainty, maybe reverse, confirmation required) and then a white candle that reflected the VIX rolling over down once again at 12:45.
3. While this trade should have ended with the XLNX hanging man at 2:30 the third entry shows that when the VIX reascended through its 10 and then 33-period moving average at 3:15, XLNX followed suit by descending through its 10-period average at the same time. This would have been an absolute signal to end the trade at that point if you were still hanging on.
Again the figures are from prophet.net - an excellent site.
Reference the figure.
1. On 7 26 2006 around 10:20 the VIX printed a topping formation. XLNX was already ascending but the 10 o'clock formation (a gravestone doji) suggested some uncertainty and perhaps even a reversal. But with the VIX topping it printed a hammer which indicates a continuation up.
2. Things begin to calm down in the noon hour and you can see that after throwing off a hanging man (reversal signal) at 12:15 the VIX then printed a hammer of its own. Note that XLNX reacted strongly to that with a black candle but that was a spinning top (uncertainty) so the trade could be kept until some confirmation appeared. This was followed by a another doji (uncertainty, maybe reverse, confirmation required) and then a white candle that reflected the VIX rolling over down once again at 12:45.
3. While this trade should have ended with the XLNX hanging man at 2:30 the third entry shows that when the VIX reascended through its 10 and then 33-period moving average at 3:15, XLNX followed suit by descending through its 10-period average at the same time. This would have been an absolute signal to end the trade at that point if you were still hanging on.

Again the figures are from prophet.net - an excellent site.
Pre-Thursday
Futures are up this morning as was Asia and as is Europe/UK. Gold jumped 8 bucks overnight because of the dollar slide. The Yen broke out of its trading range and is appreciating in value as is the Euro. Earnings are streaming in and seem to be overall strong. What's not to like?
I don't like the NR7 formation I see on all of the major indices. An NR7 is the "narrowest range in 7 days reading" and often precedes a change in market direction. Yesterday, of course, was an up-down-up-down day, totally psycho. Obviously there is enough cash on the sidelines to lift the market and enough sellers to dump it again. Glad I'm sitting this out.
The other thing I don't like is that the up/down ratio dropped again, this time to 47%. That is a neutral reading but taking it in sequence what we see are fewer stocks going up every day. That suggests a weakness in the market.
The third thing I don't like is that the VIX is better than 10% below its 10 day moving average.
Given those three things coupled with increasing earnings, end of the month festivities and a high probability that the Fed is done in August and this market is about ready to implode.
I think what it needs is a good flush-out to prepare it for the Fall. I wouldn't be surprised to see it go sideways-down into Friday then down-sideways into the Fed meeting. Then have a brief day or so of exuberance and then drop again until mid-September.
Later this morning I'll post a set-up using VIX and a stock from yesterday.
Wednesday, July 26, 2006
Wednesday
Interesting day. The VIX misprinted a spike so I switched over to the VXO. I did a study some time ago and found that there is little difference in the vectors between the two of them with the exception of magnitude. But that cuts in both directions - i.e. the VIX can lead or the VXO can lead. Six of one half a dozen of another. (Even though I'm not trading I am watching and learning).
About 10:15 on the 5 minute charts the VXO started looking weak. This only becomes obvious if you continue to observe until about 10:30. At that time I noted a gap-down, NSC (almost $6.00 down from yesterday's close), started stirring. One could have gotten in for about $40 at that time and by 2 P.M. it was at $41.25 ending the day at 41.50. This would have been a nice scalp and all you had to do was watch the volatility indices for your tip-off and have a list of gap-downs ready to go.
I lost 4 cents on INTC, 1 cent on EZM and gained 54 cents on PXE - so a good day with some profit to show.
Taking one more day off from trading tomorrow and will see what happens on Friday.
Riding The VIX
I use the VIX to help me pull the trigger on trades. The method is simple. I keep a chart of the VIX on a 5-minute basis on my screen at all times. If it prints a topping formation it tells me that I should be able to either take a long or close a short. If it prints a bottoming formation it tells me to either close any short term longs or to get short.
The figure shows this effect. The VIX is on a 5-minute basis. That permits me to be able to observe it over a 15-minute period to ensure that the signal is accurate. The object long is on a 15-minute basis. This one worked all day long even though the VIX flattened out in the mid-day period.
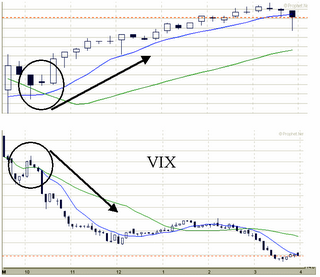
As with any trading idea you might see here or anywhere else it pays to investigate and evaluate on your own. Don't take my word for this - try it yourself and see if it fits your trading style.
The figure shows this effect. The VIX is on a 5-minute basis. That permits me to be able to observe it over a 15-minute period to ensure that the signal is accurate. The object long is on a 15-minute basis. This one worked all day long even though the VIX flattened out in the mid-day period.
As with any trading idea you might see here or anywhere else it pays to investigate and evaluate on your own. Don't take my word for this - try it yourself and see if it fits your trading style.
Tuesday, July 25, 2006
Tuesday
Well it looks like the fade the rally boys took the day off too. My holdings remain the same - INTC, EZM and PXE. All of them went up today. Gold hung around the 619 area all day.
The up/down ratio is 57% which is down from yesterday's 69% and more or less neutral territory. The faster Marlyn's curve flipped over going up 5 days ago and the slow curve rolled 2 days ago. We might be in a rally but once again I don't predict I just follow the TA and keep my stops tight.
The up/down ratio is 57% which is down from yesterday's 69% and more or less neutral territory. The faster Marlyn's curve flipped over going up 5 days ago and the slow curve rolled 2 days ago. We might be in a rally but once again I don't predict I just follow the TA and keep my stops tight.
Stop
When I first started trading placing stops was extremely difficult for me. Picking the right stop place is hard. Then once you do have a stop in place and the trade drops through it then rebounds to a new 52-week high in the same period - you want to go and hang yourself. I'm convinced that the book manager just sweeps close stops just to grab a quick scalp at the expense of the cowardly trader. That used to piss me off.
Then I realized that you are better off losing the trade to a stop loss than losing money. That's because for every sweep there are 10 instances when the stock drops through and keeps going down.
Now I use a simple rule of thumb - 20 cents for anything up to 10 dollars, 10 cents more per 10 dollars after that. So if stock cost $15 - I use a 30 cent stop, $45 - a 60 cent stop. These are for overnight trades only. For day trades I look at the volatility of the stock and if the stock is very volatile I monitor it and don't put in a stop. If I'm called away from my trading session I put in a tight 20 cent stop regardless of the cost of the trade.
The main rule of stops - don't look back. In other words if you lose the trade to a stop don't check it three or four times during the day because if it is going up you will be depressed and if it continues to go down you might be tempted to reacquire the trade. And if you do you will probably be really depressed later. I speak from experience.
Pattern Playing
Most traders who are successful have an edge, a method that they can return to when they need a score. I play patterns. I have found that given the binary nature of up or down many patterns of ups and downs repeat over and over again.
I use a pattern I call red-white-and buy quite successfully. One might call it my bread and butter pattern. This would be described simply as down-up-up. When I see this pattern in a chart I figure the next period or more is going to be up.
It is a little more complex than that as I always insist that volume, trend and 200-period moving average components meet my specifications too. For example, volume for the last 30 days must be greater than 250000 shares every day. The trend as shown by the 45-period linear regression slope must be positive and the latest close must be greater than the 200-period average. If the stock fails any of these basic tests I don't want to know about it.
I used to require a much stricter 1 million shares a day average for the past 90 days but I have found that to be overkill. If I were dealing in more than 1000 share lots I probably would go back to that requirement. I buy either 250, 500 or 1000 shares at a time. I may buy more than 1000 shares on a given trade but never on the same commission. I will sell up to 5000 shares at a time but have also sold 5000 shares 500 at a time.
I buy using limits and I sell using limits. My first ever trade was "at the market" and I will never do that again. Only because the "market" suddenly was 50 cents greater than it had been before or ever was again. One second after taking the trade I was down 50 cents a share and it never recovered.
The red-white-and buy or Down-up-up pattern works in any time period. But always keep in mind that nothing goes straight up nor straight down. Most of the time the stock market meanders sideways-up. Remember too that trading and investing are two entirely different things. A trader is always looking for a scalp and an investor is always looking for a dream. Sometimes dreams come true - most often they do not.
Monday, July 24, 2006
Monday
Strong day weak finish. If you've followed along for awhile you know that I consider a weak last hour to be a negative factor for the following day. We also have the very real fact that the SPX is pushing right up against resistance again at 1260. Basically the SPX took out the losses from Thursday and Friday as did the Dow.
The Q's however did not recover all of the Thursday/Friday loss. But all indices ended the day in an upthrust configuration which most likely will carry into tomorrow morning and then collapse through the day. If the end today had been stronger I think this rally might have a chance. VIX is at .08 off its 10-day MA and despite some people's opinion the science is clear - this means the market is once more poised to drop. The other factor is the Up/Down ratio which is 69%. Last week a similar reading after a similar up day resulted in two down days in a row.
I dumpted XLE (too early) and BGO (also too early) this morning. Dropped EXPE because in the face of an overwhelming upward momentum it went nowhere. Bought and sold WERN for the same reason. Held INTC and bought EZM both early and late. I bought PXE (an energy ETF) into the close in case the wild times continue in the Arab world.
I plan to take three days off from trading because I'm getting a little stale. So even though I will continue to post I just won't have any trades.
Saturday, July 22, 2006
Linear Regression Transition
The Linear Regression slope (LRS) is a very important technical analysis factor. It informs the trader of the general direction of the stock over a period of time. There are some traders that use the LRS as a means to track their trades, if a stock closes above the regression slope they buy it, below and they sell it. I’ve simplified the method and recommend that you read Chandre’s "The New Technical Trader" for a better explanation. Of course when the LRS is used in this way it is significantly shorter in length.
I like using the LRS in two ways. First I use the bands on each side of the LRS itself as a trading zone. For that reason I use a 45-period LRS. I’ve noted that stocks that close on the bottom line are prime candidates for rebound. I’ll discuss this method in more detail in another post. Today I want to talk about the LRS transition method.
Obviously because the linear regression method outputs a “slope” that slope can be either positive or negative or neutral. I’ve noticed that when the slope transitions from positive to negative a window opens for a little while for the stock to go up (and vice versa from negative to positive). The figure below of COCO shows this effect.

For Longs:
1. Linear Regression Slope (45 periods) transitions from positive to negative.
2. RSI(14) is in oversold territory
3. Stochastic RSI(14) is in oversold territory
4. Several periods later the stock prints a “buy-me” pattern.
Note that the stock is at the lower band of the LRS. This doesn’t necessarily happen.
For Shorts:
5. The LRS transitions from negative to positive
6. RSI(14) is in overbought territory
7. Stochastic RSI(14) is in overbought territory
8. Several periods later the stock prints a “sell-me” pattern.
Just prior to the transition the stock’s high touched the upper band of the LRS. Again this is not a necessary factor in the method.
While this doesn’t seem incredibly intuitive (a negative going slope signaling a positive going stock and vice versa) most TA is based on extremes within the confines of the stock’s normal price excursion or variances from the norm and not on direct cause and effect. Think about it for awhile and you would agree – if it were that easy – everyone would be rich.
The figure below for YHOO shows another example, this time the stock didn’t go to extremes before the transition occurred. Also the effect was more rapid. Note that you have to be ready for the “buy-me” and “sell-me” prints because they can occur soon after the transition. On the “sell-me” side the stock was hurried along by a bad earnings report among other bad earnings reports (2Q 2006).

The figures are screen caps from a wonderful on-line software program provided by stockfetcher.com. Stockfetcher is for the sophisticated user who wants to “roll his own” or for the user who wants a set of canned filters using all of the most modern TA methods. They provide a free, try me capability. Warning - don’t try it or you will want to subscribe to it.
I like using the LRS in two ways. First I use the bands on each side of the LRS itself as a trading zone. For that reason I use a 45-period LRS. I’ve noted that stocks that close on the bottom line are prime candidates for rebound. I’ll discuss this method in more detail in another post. Today I want to talk about the LRS transition method.
Obviously because the linear regression method outputs a “slope” that slope can be either positive or negative or neutral. I’ve noticed that when the slope transitions from positive to negative a window opens for a little while for the stock to go up (and vice versa from negative to positive). The figure below of COCO shows this effect.
For Longs:
1. Linear Regression Slope (45 periods) transitions from positive to negative.
2. RSI(14) is in oversold territory
3. Stochastic RSI(14) is in oversold territory
4. Several periods later the stock prints a “buy-me” pattern.
Note that the stock is at the lower band of the LRS. This doesn’t necessarily happen.
For Shorts:
5. The LRS transitions from negative to positive
6. RSI(14) is in overbought territory
7. Stochastic RSI(14) is in overbought territory
8. Several periods later the stock prints a “sell-me” pattern.
Just prior to the transition the stock’s high touched the upper band of the LRS. Again this is not a necessary factor in the method.
While this doesn’t seem incredibly intuitive (a negative going slope signaling a positive going stock and vice versa) most TA is based on extremes within the confines of the stock’s normal price excursion or variances from the norm and not on direct cause and effect. Think about it for awhile and you would agree – if it were that easy – everyone would be rich.
The figure below for YHOO shows another example, this time the stock didn’t go to extremes before the transition occurred. Also the effect was more rapid. Note that you have to be ready for the “buy-me” and “sell-me” prints because they can occur soon after the transition. On the “sell-me” side the stock was hurried along by a bad earnings report among other bad earnings reports (2Q 2006).
The figures are screen caps from a wonderful on-line software program provided by stockfetcher.com. Stockfetcher is for the sophisticated user who wants to “roll his own” or for the user who wants a set of canned filters using all of the most modern TA methods. They provide a free, try me capability. Warning - don’t try it or you will want to subscribe to it.
Friday, July 21, 2006
Friday
Took another look at SWY and decided to let the market stop me out for a good profit. If the market had been rising I would have held it but given the choppy nature of things I decided that a bird in the hand was worth more than the potential for eggs downstream - or something like that. Anyway I got 2.95 out of the trade per share purchased and I'm not going to sneeze at that or cry about it.
Played a little scalp using HANS. The way that works is I watch the VIX and if it starts to fall I try to grab up some high volatile stock such as HANS around a pivot point and ride it to the next pivot point - which is what I did. Made some on it and let the market stop me out. This is a fun way to make a living as long as the trade goes your way. I always keep a tight stop on the play and make sure I dump out at the next pivot point (unless, of course, the market is starting to run up).
Dumped SDS and I don't think these are very good funds to own. It was supposed to deliver 2x against the loss in SPY and it wasn't even close. Best I saw all week was 1.5. Anyway I took a small loss on it but I only had a small number of shares.
Sold back half my BGO - I'm getting a little leery of gold. Given the state of the mid-East I expected gold to rocket and it is doing nothing. So I sold back half today and will get rid of the rest next week if it doesn't rally over the weekend.
Bought INTC - again - I just can't pass it at this cheap a price and I don't think it will go down much more from here. Regardless of the state of the PC market, Intell chips are used in everything else so worse thing probable is that they just sit around my buy price for the next forever. My target is 18 and change or next Tuesday noon whichever comes first. (That's only part joke).
To finish the day I bought Expedia (EXPE). I bought it using a filter that I call linear regression transition. I found that when the linear regression slope transitions from positive going to negative going there exists a short term window of opportunity for the stock to go up. EXPE met that criteria.
The market is drying up (volume is going going gone) while I am typing this (12:18 P.M.) and I think I'm going to pull the plug for the week. All told I made money this week and will probably make more next so I'm happy.
Thursday, July 20, 2006
Thursday
As expected the market gapped up and then drifted down through the day. I sold HLTH and XING this morning before 10:30 and made a small profit on both but not what I wanted. I kept the BGO, SDS and SWY. SWY gained $2.25 through the day and that means it is staying on track. SDS recovered some from the SPY decline and I think they will continue to go down tomorrow and I'll get it all back and then some.
The three sisters finished in the red again and that bodes ill for tomorrow. The up/down percentage is 25% up for the day which is a serious turn-around from yesterday's 75%. I think it will probably go down again tomorrow.
The three sisters finished in the red again and that bodes ill for tomorrow. The up/down percentage is 25% up for the day which is a serious turn-around from yesterday's 75%. I think it will probably go down again tomorrow.
Pre-Thursday
A little skittish after yesterday's bear market rally. A couple of things that bode ill for today.
First the number of up issues from yesterday is over 75% - the last time we saw that on 29 June the market went down the next day. Not large but down. The one big difference between then and now is the VIX. The the VIX was 22% above its 10-day average (an extreme reading that suggests market will be going up in the next several days which it did) now it is the 10-day average. That makes it somewhat neutral as a predictor.
Bottom line - I wouldn't be surprised to see an immediate jump up (futures are supporting this amazing suggestion) and then a fade away day from there.
I could be wrong - always remember rule 1 - nobody knows nothing.
My trading plan is clear - if the market says hold I will hold otherwise I will sell HLTH and XING. I will hold SWY until the pivot point turns against me, BGO and SDS.
Wednesday, July 19, 2006
Buying Safeway
I bought Safeway (SWY) as a result of seeing that it was about to cross over its pivot point and its average close would soon follow. This is not a recommendation only something that I do to inform my trades. I like using averages because I don't mind missing an early entry and they keep me out of a lot of whipsaws. As you can see in the chart I bought it right at the point where it crossed its own average and one day before the close crossed the pivot. I will hold it until it crosses again.
Wednesday
I don’t predict – I just follow my technical analysis. It says the secular trend of the market is down and that's what it is until it isn’t. As of now I will treat every rally with caution regardless of how high it goes. Tomorrow can take everything away again just as easily.
I added some XING (on the open) based on a filter that I call “scalp set-up”. This looks for stocks that meet the basic criteria
and close 2 days ago > close 1 day ago
The kicker of this particular filter is the skip a day nature of the sequence going down and the fact that it has to have broken the sequence on its most recent day. This filter has a 64% win rate over the period 3-09 through 7-09. Remember that a filter’s purpose is to find candidates - not to make trades.
This is a modification of a set-up I found in John F. Carter’s book – Mastering the Trade – an excellent read and highly recommended.
I also added HLTH using a filter I call "red-white and buy". Three down days followed by an up day on the day of purchase (today). Buy at or near close on a white candle in the final hour. This is a good overnight filter for a short-term swing.
I’m looking for both these trades to jump tomorrow morning and I will sell them at 10:15 if two out of the first three 15-minute bars on the DIA print red. If the DIA actually continues to rise tomorrow (which I doubt) I will hold them to end of day - or until the market turns against the trade.
Sold off my BGO and TGB in the mid day (for a profit) and bought BGO back again this evening at the close. Three reasons - 1. gold (physical) kept going up through the day, 2. BGO was down from where I sold it, and, 3. BGO ended the day printing a white candle in the last hour.
SWY made a dime today and the SDS (I only have a couple of hundred shares of this) went down hard. I should have sold it yesterday afternoon on the white candles from the three sisters but I didn’t.
Yesterday the final hour saw the three sisters, DIA, SPY, and Q’s, print white candles. Today’s action bore out that optimism. This afternoon they are all printing red candles in the final hour. That doesn't necessarily mean a down day tomorrow - only an 80% probability of one.
A good day. I made some money. I am happy.
Tuesday, July 18, 2006
Tuesday
Another day another dollar. Bought some more BGO and TGB (gold miners). Bought a handful of Safeway (looks to be turning up on my pivot chart - I'll show this later). Held SDS even though it collapsed at the end of the day. Remember the market is still going down even though it ended in the green today.
So I made money on the three others and lost a few bucks on SDS.
So I made money on the three others and lost a few bucks on SDS.
Monday, July 17, 2006
Monday
I went nearly flat today. Stayed with one gold miner, a handful of SDS (double inverted SPX) and bought a small amount of SMSI at the close.
SMSI was purchased for a quick bump tomorrow morning and will probably be sold before 11 A.M.
As promised here is the current marlyn's curve for the SPX.
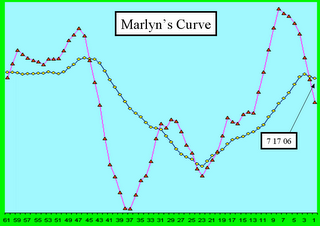
Note that the fast curve rolled over about 6 days ago. That would include last weeks 3 down days. The slow curve rolled over three days ago. Usually the slow curve stays in a trend for 12 to 20 days or so with the norm being about 18 days. Because the fast curve switches around so much I normally don't use it except as a preview of coming attractions. But if I'm heavy long when the fast curve rolls I start unloading. Normally.
SMSI was purchased for a quick bump tomorrow morning and will probably be sold before 11 A.M.
As promised here is the current marlyn's curve for the SPX.
Note that the fast curve rolled over about 6 days ago. That would include last weeks 3 down days. The slow curve rolled over three days ago. Usually the slow curve stays in a trend for 12 to 20 days or so with the norm being about 18 days. Because the fast curve switches around so much I normally don't use it except as a preview of coming attractions. But if I'm heavy long when the fast curve rolls I start unloading. Normally.
Long Day
This morning's post, Wishful Thinking, was a note to myself to do the right thing which I did. I got out of HANS this morning. Not clean, did take a loss, but I'm out. I'm now holding some miners (I will always hold the miners) and some SDS - the new Proshares double inverse SPX fund. I think the SP500 goes to 1220 before it goes back up and I'm just going to sit the rest of the dance out.
I'll post the Marlyn curve for the SPX tonight after the market closes.
I'll post the Marlyn curve for the SPX tonight after the market closes.
Wishful Thinking
Brett Steenbarger says that the worst fault a trader can have is arrogance - I say it is wishful thinking. The ability to believe something is true (or will come true) in the face of all evidence to the contrary does not make for a good trade.
If you are hoping that a stock will come back with a market rise you might be right but more often than not you will be wrong and you will lose even more money because of "wishful thinking". If you think something is bad it usually is and no amount of wishing will change the reality.
If you are hoping that a stock will come back with a market rise you might be right but more often than not you will be wrong and you will lose even more money because of "wishful thinking". If you think something is bad it usually is and no amount of wishing will change the reality.
Sunday, July 16, 2006
Up or Down?
One of the things that interests me to the point that I keep track of it every day is the number of shares trading in the range of 1 to 500 that went up vs the the total shares in that range.
We can differ on the totals but I use 7858 as the base value. The table shows the percentage of upward bound stocks on a daily basis this past week.
From the list we can see that the worst day this week was Thursday when only 18% of the possible shares went up. On Friday this was back to 30%. These numbers are reflected in the candlesticks for these days.
For Thursday the SPX printed along black stick with hardly any tail but on Friday a black hammer was printed - a tail longer than the body. I would feel better about the coming Monday if that had been a white hammer but sometimes, as we have seen in the buy-me formations, you take what you can get.
I'm not suggesting or saying that Monday is up, I just wouldn't be surprised to see a bit of a rebound next week.
But maybe not - always remember rule #1 - nobody knows nothing.
We can differ on the totals but I use 7858 as the base value. The table shows the percentage of upward bound stocks on a daily basis this past week.

From the list we can see that the worst day this week was Thursday when only 18% of the possible shares went up. On Friday this was back to 30%. These numbers are reflected in the candlesticks for these days.
For Thursday the SPX printed along black stick with hardly any tail but on Friday a black hammer was printed - a tail longer than the body. I would feel better about the coming Monday if that had been a white hammer but sometimes, as we have seen in the buy-me formations, you take what you can get.
I'm not suggesting or saying that Monday is up, I just wouldn't be surprised to see a bit of a rebound next week.
But maybe not - always remember rule #1 - nobody knows nothing.
Saturday, July 15, 2006
Buy-Me Formations
Sometimes you'll come across a stock that just keeps signalling buy-me over and over again. This past week AKAM was such a stock. Five buy-me formations in three days. The circles show the buy-me formation and the arrows show where the trade probably should have been terminated. I didn't play this stock, just something I came across in my never ending search for good setups.
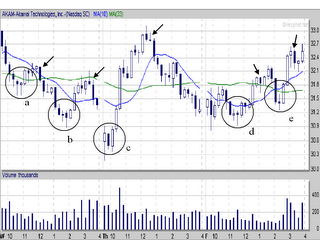
The setups at a and b are signalled by hammer formations after declines. The c setup is the best, a gap down with a long tail, a black candle followed by a long white candle. D and e both have a hammer print after a decline. If you were feeling good about the trade you might not have sold the d entry until the end of the day.
Again the chart is from prophet.net - an excellent site.
Friday, July 14, 2006
Friday
Stopped out of BEAS and SNWL, one a win the other a loss and between the two of them a wash including commissions. Watched HANS drop, drop, drop until it printed a "buy me" formation and I bought it. An hour later I sold for a nice score. Also caught a profitable run in PSQ.
Still holding positions in HANS (other than the one mentioned above) and two gold miners (TGB, BGO).
The market is so oversold it's hard not to see it going up next week. Of course it doesn't have to and could indeed crash and burn. We'll see.
Still holding positions in HANS (other than the one mentioned above) and two gold miners (TGB, BGO).
The market is so oversold it's hard not to see it going up next week. Of course it doesn't have to and could indeed crash and burn. We'll see.
Price and Volume
If volume and price rise together price will decrease. If volume and price fall together look for a price rise. These don't happen very often. What happems most of the time is that volume rises and price falls or price rises and volume falls. If price is rising while volume is falling price will continue to rise until volume changes direction. If price is falling while volume is rising price will continue to rise until volume changes direction and falls.
Clear? A picture is worth a thousand words or at least that handful above.

The line marked "a" shows an example of price rising with volume to a point then right after volume changes direction price begins to decline.
I don't use price and volume much in my daily activities because it really only seems useful (to me) for long term investment decisions. However if you know the direction and tendency of the market this would seem to be a useful indicator when deciding whether to go short or long.
This is a very smoothed diagram of price and volume action provided to illustrate the point. Don't use it in to make any investment decisions.
Thursday, July 13, 2006
Thursday
Interesting day - I left around 12:30 to go play some golf thinking that the market was heading up. It didn't. I doubled up on HANS this morning and bought BEAS, SNWL and FBR. INTC stopped out. FBR also stopped out but I'm still holding BEAS and SNWL. I think INTC will eventually go up but I'm going to wait until it hits about 18 until I buy back in.
I think that the market should pause in its downward plunge tomorrow. But it may not. If it doesn't and the Q's are down after 45 minutes I'm going to buy some of the new inverse ETFs and say oh well - it will be back someday.
I think that the market should pause in its downward plunge tomorrow. But it may not. If it doesn't and the Q's are down after 45 minutes I'm going to buy some of the new inverse ETFs and say oh well - it will be back someday.
Hedging for Fun and Profit
Rydex Dynamic and Inverse index funds have been active for quite some time. They address a need by the market place to permit market timers a place to park their funds when they think the market might be going down (as is currently suspected). The following chart shows three different fund streams, two of the Rydex funds and one of the Q's. The Q's as you know are an exchange traded fund that track the NASDAQ 100. Rydex offers a similar fund, RYVYX. They also offer an inverse fund to the RYVYX named RYVNX. In the chart you can see how the Q's track with the RYVYX (only less volatile) and how the RYVNX tracks exactly opposite to the RYVYX. I've annotated the chart with the dates of the turns for the funds.
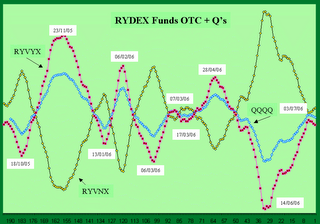
Profunds also offers mutual funds like the Rydex funds but Profunds recently brought out a set of ETFs under their Proshares trademark that track inverse to the Q's, the DIA, and the SPY ETFs. These ETFs are called PSQ, DOG, and SH. "DOG" is especially a good name for an inverse fund.
The problem with the Rydex funds is that you can only enter or exit them once a day at the close of business the day before price. The ETFs on the other hand can be bought and sold all day long.
I'm not recommending one or another, just saying that you need to explore these different kinds of trading methods if you want to keep your trading toolbox up to date.
Gap Up For Profit
While I like to play gap-downs I will play a gap-up every once in awhile. The following two charts show good gap-up opportunities. OKE gapped-up on good volume then threw off a little hammer. That would be a good place to buy. PPC is my favorite kind of gap-up - a black hammer followed by a bullish engulfing long white candle. Although both went up, OKE grades at about a B and PPC hits a B+. To get to "A" PPC would have had to have a bit of a longer body.


The sell off point on PPC would be around 27.40, 30 minutes after taking the trade. The sell off point on OKE would be about 36.20 or about an hour after taking the trade. The sell off point is a candle with a long wick on top followed by a black candle.
The sell off point on PPC would be around 27.40, 30 minutes after taking the trade. The sell off point on OKE would be about 36.20 or about an hour after taking the trade. The sell off point is a candle with a long wick on top followed by a black candle.
Be Original
Saw Pirates II on Monday and spent 2 hours and 45 minutes in a return to an age when movies actually moved, had real plots (more than one), real love stories (actual triangle), and real action all presented with genuine swashbuckling joie de vivre. Movies where you had to listen fast and think faster in order to catch all the jokes and even so missed about half of them. In other words all the reasons why most critics are panning this movie is what makes it great. Although truth be told most of the jokes were over the head of the largely ill-informed audience I attended with.
There have been two movies in my entire lifetime (and that is significant) that I wanted to go back to the theater and see again (I.E. spend money twice to see) and those were the orginal Hustler (Paul Newman, Jackie Gleason) and now Pirates II.
What makes a blockbuster - well, "remake" doesn't. Nor do special effects do the trick. Name actors? Nope. Let's face it Johnny Depp is a cult actor - you either love his body of work or hate it. Orlando Bloom and Kiera Knightly aren't exactly going to burn up the silver screen for years to come (in fact I wouldn't pay to see a movie with either of these actors in it unless Depp was in the staring role).
What makes a blockbuster is originality. Originality. Original. Unusual. Not the same. Unique. And just because some PR merchant calls something unique doesn't make it unique. It doesn't have to be spectacular (although it helps). But spectacular doesn't make unique. Nor does unique make spectacular. They are two different things.
Most successful trading comes from originality. Uniqueness. You make a trade the crowd doesn't. You make a trade the crowd couldn't see in a million years. When you do and you win you will win large nearly everytime.
Be original.
Wednesday, July 12, 2006
Wednesday
Complete turnaround. Yesterday I predicted a rise through the end of the week. So much for predicting. Remember rule 1 - nobody knows nothing. If you read these blogs and start believing in folks trust me you will go broke.
Worse yet if you start paying for information and believing because you pay for it it must be good. Everyone is right every once in awhile - no one is right all the time.
Anyway my account went backwards but not as bad as Monday so I'm ahead for the week. Big deal. I took a small position in INTC this afternoon. It looks like it could go up in the next several days. If it does great - if it hits my stop - oh well.
So better trading tomorrow. If the market follows the recent pattern tomorrow will be an up day and another opportunity to sell everything and get flat.
Tuesday, July 11, 2006
Tuesday
Made some money today. HANS came back strong and so did my gold miners. Took a position in RNWK off a "buy me" print this morning and am still holding it.
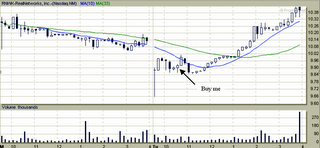
It is still making money. I think we might have a couple of good days into the end of the week.
The chart as indicated in the upper right corner comes from prophet.net. If you get a chance go by there and take a look.
It is still making money. I think we might have a couple of good days into the end of the week.
The chart as indicated in the upper right corner comes from prophet.net. If you get a chance go by there and take a look.
Buy Me Don't Buy Me
Here is an example of the "buy me" formation along with a good example of one that should be passed.
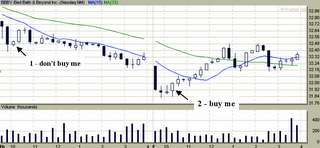
At point 1 we see a small white candle at bar 3 and itappears as if the stock is turning around. The climb never exceeds the long black candle at bar 2 and finally at bar 5 resolves itself as a doji. That is the first real indicator that this is not a good buy.
On the very next day we get a long black candle gap down. This is followed by a spinning top (indecision) and then a black doji. The fourth candle prints a hammer (2) and that says "buy me" to all who care to listen to the market.
As usual the charts come from Prophet.net - an excellent site.
Monday, July 10, 2006
Monday
Oh what a day. Metals are down - there goes my gold miners. HANS does its 4 for 1 split and everyone sells half their holdings (I did, I didn't expect everyone else to do so also). So on a day that looked half bad it was half bad. Fortunately I did sell half my HANS so the loss was somewhat offset by some small gains.
Oh well - sit on it for a couple of days and see if it turns around. If not then sell.
Bought some NXG today. Probably not a good buy but it didn't lose any money and if it doesn't move tomorrow its gone.
Oh well - sit on it for a couple of days and see if it turns around. If not then sell.
Bought some NXG today. Probably not a good buy but it didn't lose any money and if it doesn't move tomorrow its gone.
Saturday, July 08, 2006
Quick Tip #3
The talking heads on crapvision call the time between 3 P.M. and 4 P.M. the most important hour of the day. It isn't for traders. The most important hour is the first one. But the last hour does serve a purpose.
After the market closes bring up an hourly chart of the previous session for DIA, SPY and QQQQ. If the last hour prints a doji or a white candle the next day, barring catastrophic news, will probably open higher.
After the market closes bring up an hourly chart of the previous session for DIA, SPY and QQQQ. If the last hour prints a doji or a white candle the next day, barring catastrophic news, will probably open higher.
Friday, July 07, 2006
Friday
I made money today - hope you did too.
I dumped UDR because it, like the market, was going nowhere and I can use those funds someplace else. I picked up some HANS in front of its 4 for 1 split on Monday. It went up $8 from my buy price and then fell back again. I hate leaving a profit so I said the hell with the split and stopped out for a nice gain. My thinking at the time was if it dropped back to where I bought this morning I would pick it up again. Well it didn't but I still got it back plus more for where I was stopped out this morning. This means with any luck at all I'll have 4x the number of shares working on Monday. It is such a volatile stock I expect it to start climbing again immediately. At which time I will sell it.
Picked up a load of ARRS on a "buy me" set up. This, of course, was a day trade. It went nowhere and I sold for a small loss.
Still holding gold shares and I blew off the oil for the weekend. If it pulls back some more I'll try to grab some before the next rally.
Here's a "buy me" set-up I missed today. I found this one from a filter I've been trying that selects stocks that are closing at their 52-week low. I don't ordinarily like that kind of play but if I can find a set-up like this one it makes sense to grab it.
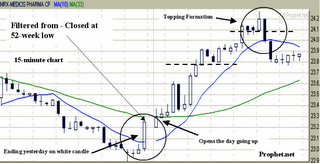
Unfortunately I was involved with some other things today and missed this one completely. When compared to ARRS which was a complete waste of time I should have had this one instead. Oh well - there's always Monday.
I'll do a test on the 52-week low filter this weekend and let you know how it works.
Once again - the chart comes from prophet.net.
I dumped UDR because it, like the market, was going nowhere and I can use those funds someplace else. I picked up some HANS in front of its 4 for 1 split on Monday. It went up $8 from my buy price and then fell back again. I hate leaving a profit so I said the hell with the split and stopped out for a nice gain. My thinking at the time was if it dropped back to where I bought this morning I would pick it up again. Well it didn't but I still got it back plus more for where I was stopped out this morning. This means with any luck at all I'll have 4x the number of shares working on Monday. It is such a volatile stock I expect it to start climbing again immediately. At which time I will sell it.
Picked up a load of ARRS on a "buy me" set up. This, of course, was a day trade. It went nowhere and I sold for a small loss.
Still holding gold shares and I blew off the oil for the weekend. If it pulls back some more I'll try to grab some before the next rally.
Here's a "buy me" set-up I missed today. I found this one from a filter I've been trying that selects stocks that are closing at their 52-week low. I don't ordinarily like that kind of play but if I can find a set-up like this one it makes sense to grab it.
Unfortunately I was involved with some other things today and missed this one completely. When compared to ARRS which was a complete waste of time I should have had this one instead. Oh well - there's always Monday.
I'll do a test on the 52-week low filter this weekend and let you know how it works.
Once again - the chart comes from prophet.net.
Thursday, July 06, 2006
Thursday
Lost a little today. Gold shares went down several cents and so did UDR. Tried to catch XMSR on a "buy me" set up but it went nowhere and I sold it at break even. The DOW was up but basically only recaptured what it lost yesterday. Most of the gain was on Altria and the good news that they don't have to pay billions of dollars in penalties. Transports were down heavy as was NASDAQ. SPX was up a couple of points but nothing to get excited about.
I think the market is going to drift through the rest of July and go down through August.
I think the market is going to drift through the rest of July and go down through August.
Wednesday, July 05, 2006
Wednesday
I made money today I hope you did too. My gold shares were up, my energy shares broke even, UDR the little stock I bought Monday was up and in the middle of the day I bought several hundred shares of ATHR and sold it several hours later for a profit.
I had been watching ATHR because it had attempted to make a run earlier in the morning. Finally around 11:30 it printed what I call a "buy me" formation and I did so. Around 1:45 or so I sold it because it printed a "sell me" formation. This looks like this.
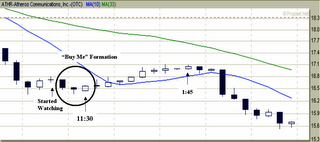
Sometimes these things work out better than others. This was a profitable trade but because the market was off today it wasn't as good as it could have been. As the afternoon wore on ATHR proved that it was wore out.
The figure is a screen cap from prophet.net which is an extremely good web site that provides both a free service (non-real time) and a real-time service for pay. I use prophet.net for both post-trade analysis and to scan for tradable stocks using gap-ups and gap-downs.
Everything I know about gap-up and gap-down trading I learned from Trader-X who's blog is listed to the right (Day Trading). I highly recommend both those sites.
Growth or Value
The problem with the question is most people don't know the difference between a growth or value stock.
A growth stock is defined by investopedia (investopedia.com) as "a company whose earnings are expected to grow at an above average rate relative to the market."
A value stock is defined as "... stocks include a high dividend yield, low price-to-book ratio and/or low price-to-earnings ratio."
Is that better? No, didn't think so. I looked on the "ishares.com" site at the two of the more popular ETFs - the IWN and IWO. IWN is the Russell 2000 Value ETF and it contains holdings such as Vertex Pharma, Level 3 Comms and Cimmaron Energy to name a few. IWO is the Russell 2000 Growth ETF and it contains names such as Amylin Pharma, Frontier Oil and Hansen Natural (the famous soda maker).
IWM, of course, is the daddy of the Russell 2000 ETFs and contains both IWN and IWO.
Confused yet? It gets better. If IWM contains both then why not just buy IWM and get it over with? Well that would be a good strategy if you were in doubt or wanted to take an average between the two children but look at this figure first (Marlyn's Curve).
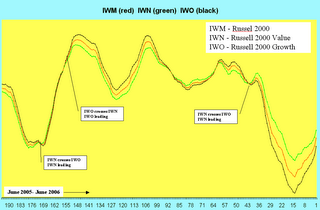
In this figure we see the past year's values for the three funds overlayed on one chart. As you can see IWM rides between the two children. Note that sometimes growth outperforms value and sometimes value outperforms growth. But the important thing to note is that they all move in synch with one another. I.E. When the market goes up - they all go up, when the market comes down - they all come down. So growth or value - I'm not sure how you would choose between them. Maybe this is just one more way for Wall Street to take advantage of you.
A growth stock is defined by investopedia (investopedia.com) as "a company whose earnings are expected to grow at an above average rate relative to the market."
A value stock is defined as "... stocks include a high dividend yield, low price-to-book ratio and/or low price-to-earnings ratio."
Is that better? No, didn't think so. I looked on the "ishares.com" site at the two of the more popular ETFs - the IWN and IWO. IWN is the Russell 2000 Value ETF and it contains holdings such as Vertex Pharma, Level 3 Comms and Cimmaron Energy to name a few. IWO is the Russell 2000 Growth ETF and it contains names such as Amylin Pharma, Frontier Oil and Hansen Natural (the famous soda maker).
IWM, of course, is the daddy of the Russell 2000 ETFs and contains both IWN and IWO.
Confused yet? It gets better. If IWM contains both then why not just buy IWM and get it over with? Well that would be a good strategy if you were in doubt or wanted to take an average between the two children but look at this figure first (Marlyn's Curve).
In this figure we see the past year's values for the three funds overlayed on one chart. As you can see IWM rides between the two children. Note that sometimes growth outperforms value and sometimes value outperforms growth. But the important thing to note is that they all move in synch with one another. I.E. When the market goes up - they all go up, when the market comes down - they all come down. So growth or value - I'm not sure how you would choose between them. Maybe this is just one more way for Wall Street to take advantage of you.
Tuesday, July 04, 2006
Candlesticks
The second greatest technical analysis invention after moving averages was candlesticks. The Japanese invented this concept of showing market moves by white and black figures. If you don’t know candlesticks and you think you are a trader you are wrong. There are dozens of books and sites (free) on the Internet that will contain more than enough information for you to be able to learn this critical skill.
If after studying the sticks for a little while you can’t tell by looking at a chart where the market should go (80+% probability) in the next period you need another job, career or hobby. You aren’t a trader.
Use Google or your favorite search engine, type in "Candlesticks" (one word) and sit back and learn.
Monday, July 03, 2006
5-Day Up
I like filters to be extremely simple. I also like a filter that returns a managable number of opportunities. For example I could test against the entire spectrum of stocks but I already know that some I simply won't buy because they are either too cheap or too expensive. Too cheap do not move enough in a short enough time to make them worth my time. Too expensive hold a higher order of risk than I'm willing to accept.
Another of my preferences is for stocks that are above their 200 day moving averages.
And I like my filters to follow a specific theme. My method of stock selection relies on the concept of regression to the mean. In other words the market see-saws up and down and in the process always overshoots its null point which is its perfect balance between buyers and sellers. My filters reflect this theme. My very first and as it turned out extremely profitable filter was a simple one - close above 200 day average, close below 20 day average, close above 5 day average.
I also like using a short time period, 5, 10 or 20 days. And I keep the dollar value of the filter at a level where I can buy at least 500 to 1000 shares of any stock I decide to buy using my trading account. And I like the volume to be at least 500000 shares a day.
The 5-day up is a simple filter that looks for stocks where the 5-day moving average is increasing while the 5-day moving average of the 5-day moving average is decreasing.

I tested this filter using the three time standards noted earlier and here are the results.
You can see that the win percentage in the up market and the negative ROI in the down market are both significant. You can also see how even a simple filter such as this one can fail during the 6-month period we've just been through.
Another of my preferences is for stocks that are above their 200 day moving averages.
And I like my filters to follow a specific theme. My method of stock selection relies on the concept of regression to the mean. In other words the market see-saws up and down and in the process always overshoots its null point which is its perfect balance between buyers and sellers. My filters reflect this theme. My very first and as it turned out extremely profitable filter was a simple one - close above 200 day average, close below 20 day average, close above 5 day average.
I also like using a short time period, 5, 10 or 20 days. And I keep the dollar value of the filter at a level where I can buy at least 500 to 1000 shares of any stock I decide to buy using my trading account. And I like the volume to be at least 500000 shares a day.
The 5-day up is a simple filter that looks for stocks where the 5-day moving average is increasing while the 5-day moving average of the 5-day moving average is decreasing.
I tested this filter using the three time standards noted earlier and here are the results.
| Direction | Start | End | # Trades | Win % | ROI % | SPX ROI % |
| Current | 3/2/06 | 06/30/06 | 699 | 58 | -23 | -4.19 |
| Up | 3/9/06 | 5/12/06 | 443 | 67 | 25 | 5.28 |
| Down | 4/27/06 | 6/30/06 | 300 | 51 | -67 | -14.46 |
You can see that the win percentage in the up market and the negative ROI in the down market are both significant. You can also see how even a simple filter such as this one can fail during the 6-month period we've just been through.
Monday
Well I made money today - hope you did too. I'm holding gold (TGB, BGO), energy (PXE) and UDR, a REIT.
The very first stock I ever owned was a REIT. I don't remember the name as it was over 40 years ago but I do know that I held that stock for about 10 years and sold it at a serious profit. I don't intend to hold UDR that long. I'm looking for 29 and change and then I'll sell it. I found it as a result of a filter I am using that I call 10-up.
This is an interesting filter. It looks for stocks where the 10-day average 2 days ago is more than .25% below the 10-day moving average of its 10-day average 2 days ago and currently its 10-day average is less than .25% below the 10-day moving average of its 10-day average. In other words the stock is turning up from a distressed state. It looks like this.

I think, given this will be a rather weak week that 29 and change is an ok number for UDR.
Metals and energy are still leading up. Don't worry, the taking heads on crapvision will try to talk you out of the winning trades and into something that Goldman or Lehman is pushing - don't let them.
Always remember rule 1.
pivot point
The pivot point is found by summing the high, low and close then dividing by 3. Statistically the next day's price will trade through the pivot point either higher or lower or both. One day while playing around with the pivot point of a stock I discovered something valuable. I found that if I averaged the pivot point and averaged the closing price and plotted them together on a single chart I would get something that looks like this.

What you see is the actual close, the pivot point 5-period average in black, and the closing price 5-period average in red. I've annotated the highs and lows. Generally when the closing price average crosses over the pivot point average it usually means a good run up is coming and when the pivot point crosses over the closing price from above it generally leads to a good short.
What you see is the actual close, the pivot point 5-period average in black, and the closing price 5-period average in red. I've annotated the highs and lows. Generally when the closing price average crosses over the pivot point average it usually means a good run up is coming and when the pivot point crosses over the closing price from above it generally leads to a good short.
Sunday, July 02, 2006
Staying In Tune
There are three indices that I track every day. These are the Dow Industrials (INDU), the S&P500 (SPX), and Gold (using the gold ETF GLD)
I have compared the INDU to the SPX many times and I always find that the two indices are pretty much carbon copies of one another. Sometimes turns are lead by the SPX and sometimes by the INDU. But when both indices are going in the same direction that is a powerful indicator of general market direction. Now if you were to look at this on a day to day basis you would see the normal ups and downs. Because what is being shown (Marlyn's Curve) is an average it appears more benign. I've filtered the volatility out to make a better presentation.
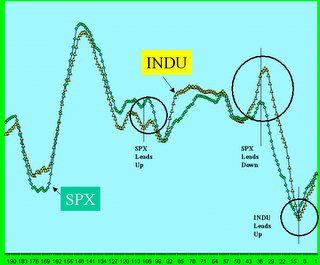
I track gold because I think that gold is the "canary in the mine" for the world's economy. I don't know why gold all of a sudden started going up, all I know is I don't think it reflects an increased appreciation of jewelry nor is it necessarily a good thing. And whenever you hear the talking heads blovating on the subject - see Rule 1.
Using Averages
I like using averages for keying trades because I like to follow the trend and when the average turns the trend is in place. But if I take a trade using a 20 period average as a main line and its 5 period average as a trigger, I will normally use a shorter period or even an exponential average to signal the end of the trade. I don't mind going in a little late but I hate coming out late.
The Rules
Every once in awhile I see another set of "trading rules" being published by one or another of the blogs. Many times one reprints a set from somewhere else and then others provide links to the reprint. There is nothing wrong with that but here, finally, is the only set of rules you will ever need in trading.
1. Nobody knows nothing.
2. Trust your instincts - if it looks bad it is.
3. When in doubt refer to rule #1 and add "including you".
This means - if you can't figure it out on your own you need to get a different job, hobby, career. Trading is not your game. I busted out several times before I finally learned how. And what I learned was to stop following self-proclaimed gurus. If they really knew about the next hot stock - why the hell would they tell you?
And you can trust me on this, when somebody says that all he wants to do is make you rich - really - all he wants to do is make himself richer. Take it to the bank.
Saturday, July 01, 2006
Marlyn's Curve
Some years ago I devised a means to keep track of the direction of the market using the closing price as it related to past prices. This resolved to an open-ended oscillator that would roll over heading up at the bottom and heading down at the top. It is fairly simple-minded and easily calculated and while it lags somewhat turns can be anticipated by using a more sensitive signal line.
I call this oscillator Marlyn's Curve.
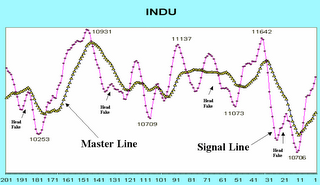
Because you won't find this on any commercially available product there is no sense in explaining the calculation to you. But as you can see there are two lines, a master line and a signal line. The signal line often does what I call a "head fake" which is something I borrowed from John Bollinger's Bollinger Bands. The head fake is when the more sensitive line anticipates a turn and turns early. I have learned to ignore that turn but to prepare for a major turn within 10 days or so.
I generally take trades when the master line turns up which is usually several periods after the signal line makes its head fake. I was also playing the Rydex inverse funds on the downturns but will now begin playing the new Proshares inverse ETFs instead. Easy in and out.
Yes the price annotations are correct since this oscillator doesn't value magnitude so much as direction. The overall period shown is the past year in the market. You can see as well as I can why you couldn't make much money for the past six months. The market had no clear direction during much of 2006. Consequently it was neither a bull nor a bear.
Filter Testing
The objective of filter testing is to discover technical analysis methods that will work in various kinds of markets. As you know the market goes up and the market goes down. It does this on any scale that you would care to use (minute, 5 minute, 60 minute, daily, weekly, monthly).
When I develop a filter I test it over various time periods. What I am looking for are periods when the market is going up and periods when it is going down in a recent time frame.
Consequently when I do a filter test (test a filtering method) I use 3 periods:
– The most recent 90-days terminating within the last 2 weeks,
– The most recent 45 days of the last 6 months when the bias of the market was up, and,
– The most recent 45 days of the last 6 months when the bias of the market was down.
By using three periods such as these I can see how well the filter works in various types of markets.
The second thing I do is to use a baseline filter. That is a filter I have been using for many years. The baseline gives me a sense for the periods being tested. Too many winners or losers suggest that the periods are too extreme for normal use.
You will notice that I don’t test against a hundred years of market data because that would be the most useless, time wasting testing that could ever be done. There are sites out there that will sell you their filter results based on such testing. If you feel comfortable using filters that were really, really good during 1995 – go for it.
The baseline filter is very simple. The closing price is between 10 and 20, the average volume over the last 90 days is 500000 shares/day, the closing price is at least 10% over the 200 day moving average and the 45-day linear regression slope is greater than 0.
Right away you can see that there are a number of interesting components to such a test method. First the number of trades changes with the market conditions. Second the win percentage changes. But most incredible is the variance in the return on investment between when the market is going up and when the market is going down. Remember the screen didn’t change only the general market conditions changed. Also note that the test periods overlapped one another. When you are testing your own filters it makes sense to use an approach such as mine.
When I develop a filter I test it over various time periods. What I am looking for are periods when the market is going up and periods when it is going down in a recent time frame.
Consequently when I do a filter test (test a filtering method) I use 3 periods:
– The most recent 90-days terminating within the last 2 weeks,
– The most recent 45 days of the last 6 months when the bias of the market was up, and,
– The most recent 45 days of the last 6 months when the bias of the market was down.
By using three periods such as these I can see how well the filter works in various types of markets.
The second thing I do is to use a baseline filter. That is a filter I have been using for many years. The baseline gives me a sense for the periods being tested. Too many winners or losers suggest that the periods are too extreme for normal use.
You will notice that I don’t test against a hundred years of market data because that would be the most useless, time wasting testing that could ever be done. There are sites out there that will sell you their filter results based on such testing. If you feel comfortable using filters that were really, really good during 1995 – go for it.
The baseline filter is very simple. The closing price is between 10 and 20, the average volume over the last 90 days is 500000 shares/day, the closing price is at least 10% over the 200 day moving average and the 45-day linear regression slope is greater than 0.
| Direction | Start | End | #trades | Win% | ROI% | SPX ROI % |
| Current | 3/2/06 | 06/30/06 | 1434 | 56 | 29 | -4.19 |
| Up | 3/9/06 | 5/12/06 | 976 | 63 | 51 | 5.28 |
| Down | 4/27/06 | 6/30/06 | 515 | 43 | -129 | -14.46 |
Right away you can see that there are a number of interesting components to such a test method. First the number of trades changes with the market conditions. Second the win percentage changes. But most incredible is the variance in the return on investment between when the market is going up and when the market is going down. Remember the screen didn’t change only the general market conditions changed. Also note that the test periods overlapped one another. When you are testing your own filters it makes sense to use an approach such as mine.
Quick Tip #2
The converse to Quick Tip #1 also holds. If the fourth 15-minute bar of the DIA closes below the open of the first 15-minute bar the market will probably go down for the day.
Quick Tip #1
When the market opens the first hour often dictates the remainder of the day. I've found that if the close of the fourth 15-minute bar on the DIA is greater than the open of the first 15-minute bar then the market generally goes up the rest of the day.
Subscribe to:
Posts (Atom)
