The magic coin is 33 and 22 - missed today. I nailed it though simply by noting that the market was ready to bounce. And bounce it did - albeit very, very small rewards.
Notice that the plot line wasn't because the dollar mysteriously strengthened or oil dropped a lot or retail sales improved or anything else - in fact the Fed said that interest rate cuts were unlikely (bet me). The market went up because there was something to buy - it really is that simple.
I did nothing today because it was a gorgeous day here in Maryland. I went and played golf instead. I'm going on vacation for the rest of the week - so if the market goes down tomorrow - so what and if it goes back up the next day - so what - I don't intend to do any trading until next Monday at the earliest.
I also won't be posting after this one until Friday at the earliest and probably not until this weekend.
Anyway the up/down ratio returned to neutral as did the 20 day new highs at 275 and the 20 day new lows at 419. The three sisters all finished with doji as did IWM, the ugly stepsister. The proxy for the stock market of the 22nd century printed a strong white candle in the last hour. All of this put together probably means nobody knows nothing which, of course, is rule 1.
The magic coin calls tomorrow ... tails - bear coming - who cares. See you all this weekend.
Tuesday, November 28, 2006
"Oil and Dollar Woes
brought low the stock market on Monday November 27, 2006. A low dollar and increasing oil prices blah blah blah".
The Standard and Poors 500 Index declined 1% yesterday.
Those who read this BLOG regularly (thanks Mom) should know by now that the only thing that moves the market up are things to buy and the only thing that moves the market down are things to sell. Lately, like for the last two weeks or so there really hasn't been a whole lot to buy (hence the crazy mad buying spree in PNTR last Friday) but there has been a whole lot of things to sell. And yesterday was just a great day to sell.
Now here's what I would like you to think about. In 2005 the day after Thanksgiving was a low volume day. It took three days the next week but the market declined 1% off the price on the day after Thanksgiving. The next day it rebound and hasn't stopped yet.
But in 2004 was there a 1% decline? Same scenario but no just a small decline and then a rebound from that.
How about 2003? Same scenario again but no decline at all just up up up. But this was an aberration.
Because in 2002 there was a 2 day decline by 1% with a rebound after that and in 2001 there was a 3 day decline by 1% with a 2% rebound (in the midst of a bear market) the very next day.
If the shorty's out there are licking their chops and thinking about amazing wealth leading to maybe a Ford Focus under the tree this year - watch your step.
Monday, November 27, 2006
Monday Wraps a Big One
Wow! Finally a 1% and then some decline in the S&P500. This is goodness for those of us who specialize in the long end of the stock market. But because I'm an excellent trader I actually made money today on the long side. I played Dollar General (DG) this morning and took an $80 and change loss on it after about an hour and a half. Later in the afternoon I saw the unmistakable signs (again) of a bottom and played once more - this time with more success. Both buys were off what appeared to be a dummy spot. The problem with the first one was that it followed a low volume candle and that made it a low probability trade. But the second one was following a high volume candle which raised its success probability appreciably. Also after the second dummy spot there was a gap up and I took the trade on that formation.
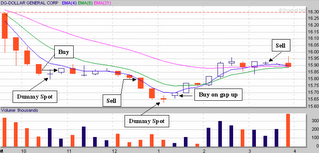
So you see even in a market as relentlessly sold off as today's was - if you pay attention you can make money long. Or, even in a market as relentlessly sold off as today's was - if you had gone short DG at the second time I went long you would have lost money. You have to be careful.
Are we now going to see many days of down - I don't think so. The market in general needed a good shake out and today it got it.
The up/down ratio sits at 18%(!), new 20 day high printed 156 (!) and new 20 day lows printed 607 (!). The VIX is now 15% above (!) its 10 day moving average and the three sisters, the ugly stepsister and the proxy for the stock market of the 22nd century - Goldman Sachs (GS) all threw off red candles in the last hour. How beautiful is all of this when put together in this manner? Boomer tomorrow - maybe.
The magic coin loses another and goes to 33 and 21 - not so good. For tomorrow it sees a bear. Dumb coin.
You better watch out, better not shout - Santa Claus is coming to town.
Sunday, November 26, 2006
Now For Something A Little Different
Well not really – we’re still going to talk about markets and trading. But as promised here is a look at what happens on gap ups over the next day or so. And there were some interesting findings. I looked at stocks in my favorite range of 20 – 35 dollars and I built a filter that simply said:
Show stocks where close is between 20 and 35 and;
the 90 day average volume is more than 500000 shares; and
the close is less than the EMA 90 (from the other day’s post); and
the close is greater than the open; and the open was greater than the close of 1 day ago.
Then I began testing it to determine what the best set of conditions would be. What I found was by using a stop loss of 10%, a 2 day maximum holding period, buying no more than 2 stocks in any one day and holding no more than 4 stocks in the portfolio at any one time I could achieve optimum results.
I had no exit based on a profit percentage I just held the stocks for 2 days and sold them at the close on the second day. By doing this I could take a 100K trading account and yield 51K profit in 77 days.
Nobody can do that of course but that was the best yield I could attain in my back testing. What this suggests is that you if you use a short term holding period with a few stocks that meet the above filter requirements you will probably make some money. Each day the 2 stocks are to be selected based on the 2 highest average volume stocks found in that days filter output. By limiting the portfolio to no more than 4 stocks at a time I optimized the number of shares purchased simply by using 25% of the total available portfolio up to the amount of cash available.
I don’t know how many different runs I made but they were substantial. And my findings are interesting in their own light. For example if I set the system to hold 10 days maximum under the same buying and portfolio conditions the yield was only 23K. That suggests that stocks that gap up have a short half-life and you should take advantage of them as quickly as you can. Fortunately there are a lot of gap ups every day.
Another finding that should be obvious is the fact that the more stocks you hold the fewer stocks you can buy given a finite trading account. This means that if you back test be sure to set your starting cash position to something that is reasonable. I always think that diversification is a word brokers use to get more commissions. Now if you diversify by hedging one investment against another – well that’s different. But if you diversify by holding 40 stocks in a portfolio – that’s stupid.
Needless to say you can not roll your funds over as fluidly as you can in a back test environment – there is no three-day hi-jack period where the brokerage makes money from your money and you do not. Nor do you pay commissions in the back test world.
And of course you always get the optimal open and closing prices but once again the dollar value is only an indicator that suggests the optimization of the conditions.
As usual this is not an invitation to speculate in the wonderful world of high finance because as most of my reader (hi Mom) knows - it isn't a place for nice people to be found.
Saturday, November 25, 2006
Blind Squirrel Finds Acorn
Sometimes you just stumble across things. There's no "eureka" moment - it just happens - it happens. Earlier I mentioned that I was working on an idea regarding an exponential moving average crossing a simple moving average. I thought that might make for a nice swing trade idea. It didn't work.
Since then I read something that Jim Cramer said the other day regarding speculative stocks. He said if you speculate you should remain between $2 and $10 as that was where you would find the best bets. I'm paraphrasing - Jim always calls it "investing" but we know what he really means don't we gang - wink-wink-nudge-nudge (second time today).
Anyway I tried "EMA 21 crosses MA 20" filter for stocks in the $2 to $10 range and I started getting some good hits. I added a volume requirement (90 day average .5 million shares) to weed out the weak sisters and then added the fact that they should be below the EMA 90 at least 4 days ago (based on swing trading findings from earlier). After looking at the results of the scans over several days in the past (another stockfetcher capability) I dropped the value requirement from $10 to $7 and began to backtest.
I set up a simple enough test using several variations. First - stop loss, second - number of days held, third - number of stocks bought daily, and fourth number of stocks held in the portfolio.
After many runs I settled on stop loss = 10%, no profit exit, sell after 4 days (or stop loss hit), buy only 1 stock per day and never have more than 4 in the portfolio at any given time. The no profit exit option was selected because I decided that I didn't want to cut off my profit potential since I was only holding 4 days.
Result of the test - in 77 days out of 77 stocks purchased and held 4 days only 7 were stopped out - the rest were sold after 4 days or on the last day of the test. Bottom line - using a $100K account - the filter racked up a whopping plus $43727. The maximum loss was $3417.00 and that occurred early in the process.
Now I'm not saying that you can make this kind of money from such a simple system nor am I saying that I can but here's the bottom line. I changed the dollar requirement from 2 to 7 to 20 to 70 with a commensurate increase in the volume requirement and the return was $560.00. So given slippage and the need to buy several thousand shares of cheap stocks as well as find a buyer for same 4 days later you probably can cut the 43K in half and make it a more reasonable 20K. But you don't have to cut that 560 bucks in half - you will probably get that whole amount.
Point being a simple filter can return remarkable results if the venue is correct. Something like this can work on cheap stocks because you only need a dime or a quarter to make some money off them whereas on the more expensive stocks you need a lot bigger move.
Anyway past performance is never a good judge of future performance and keep in mind that the test period selected was also the period of recent market gains as a whole.
I'm going to be looking at the day(s) after a spectacular gap up and rise in a future post. Stay tuned.
Here Comes Santa Claus
Although there is a lot of talk about a Santa Claus rally all I see are the indices rolling over and pointing down. This is expected from the INDU (DIA) of course - it has had a great run and needs a rest, but the SPY and IWM are also rolling. Where they go, generally, NASDAQ will also go.
I've been expecting an overall decline in the market for some time now (who hasn't) and wouldn't be surprised to see it slide down through December then start getting active again in January. If the last seven days are a clue there is absolutely no volatility left in this old beast at all. The VIX is signalling that the market ahead should remain largely listless. The other day (Friday) was the first sign of life the VIX has shown in a while. Of course it could go right back to sleep but I think it will start increasing here as a signal that some volatility will be coming back into the market come January.
We'll see.
Am I Playing Enough?
Some traders seem to believe that the key to fortune is more trades - they can't get enough trades going. That might be a wrong idea.
Using my filtering website - stockfetcher.com - I set up a test that output results of different levels of trading activity. I used 1, 2, 4 and 25 a day maximum with a 5% profit exit and 10% stop loss. I still held only 4 days maximum. Here are the results of a 77 day trading period:
Trades Per Day/Portfolio - Amount Profit
1/4 - $9746
2/8 - $8933
4/16 - $6227
25/100 - $629
OK - same trading account - same trading period - same filter being used to select candidates. The only difference being the number of stocks that can be traded and the number of stocks in the portfolio.
Because the raw amount is the total profit at the end of the trading period it is obvious that 1 or 2 trades per day will yield the best results.
Now remember that there are many different ways to slice the number of trades you are in at any one time but this seems to be saying that having fewer is better.
Are You Holding It Long Enough?
How many times have I read on one BLOG or another - "man - I sold that one too early" - for that matter how many times have I said that? At least once that I remember - - (actually more times than I care to remember).
Well let me tell you this about that - for every time you hear or read that statement there are probably 10 more times when someone says - "held it too long - lost all my gains."
I decided to test a premise or two regarding this idea of "holding too long/not long enough" and came up with some amazing results. The filtering software I use - stockfetcher.com - has the capability to do moderately sophisticated backtesting. One of the things it allows is for you to set-up a variety of exit criteria. I thought I'd take advantage of that capability.
I took a very simple filter that I am working on - one moving average crossing another that throws off a profit over time. (Actually it is an EMA crossing a simple moving average and it seems to have promise - if it proves out I'll publish it - I promise.) What I did was set up a simple exit criteria - a stop loss set at 10% coupled with three levels of profit for exit - 5%, 10% or 15%. In other words if I hit a profit at one the pre-selected levels I would close the trade. I kept my normal set-up regarding number of plays per day (1) and number of stocks in the portfolio (4) and number of days to hold maximum at 4.
Here are the results: 5% profit = $9746, 10% profit = $9479 and 15% profit = $4546
Amazing - by asking for a lower profit performance we actually achieved twice the amount of profits.
Ok a couple of things. First - the exact same set of stocks were selected and played in all three tests. Second - only closing values were used. In other words if any stock hit 15% intraday and then traded below that at the close - it was held another day and it might not have reached 15% again. Third all holdings regardless of their profit/loss status were sold on the fourth day of holding or on the last day of the test.
Bottom line of that - if a human were watching this they might have improved on the numbers a bit. But because the results at 5% are twice as good as 15% and the 10% result is nearly as good as the 5% I wouldn't expect great improvements - some maybe but not great ones and - by keeping the entire thing mechanical you can't second guess.
So it appears if you lower your profit target there is a possibility that you will increase your profitability. And that is always nice - isn't it?
PNTR - What A Ride
No I didn't play this piece of crap (POC) - I know of people who did - but for me - well let me say that first - it was, up until Wednesday, a low volume, never-traded stock. You want proof? Take a look -

On Monday and Tuesday it was traded twice - once each day for 200 shares each - On Wednesday it started heating up as a result of earnings. Earnings were - 14 cents per share vs a year earlier where they were -14 cents per share.
Second, for what it is worth, it is an Israeli company that specializes in - road-side assistance. Oh yes, oh yes my kind of company - let me have a bigger piece of pie please - please. - But more importantly - it is below my dollar value cutoff - I try not to play anything below 20 and everytime that I do I always renew my vow to never again play anything below 20. Hope you got that point.
So on a day where there was no action (Friday), someone notices that this little POC is catching a bid and - boom city. All the way to 25 before it collapses.
Interesting enough - the little guy actually set up quite nicely - a standard kiss the EMA 4 and take off kind of set up. See how the stock goes up then slides sideways to the EMA 4? You've seen that set up before on this site.

So had I noticed it would I have played it? Not even if I was playing with your money Bunky - this was a disaster waiting to happen - somebody bought this stock up at 25 points and - boom! Actually a lot of somebodies bought this thing all the way from 15.16 (where it ended) to 25 where it topped and I bet some of them are still sorry today.
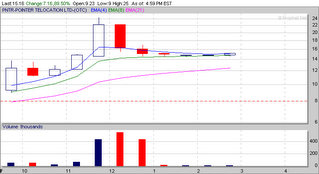
That large red blue volume line at 11:30 followed by an even larger red volume line at 12:00 suggests that 11:30 was a "blow-off top" - you've seen those before - on this site.
Unfortunately it didn't collapse all at once - there were still a whole lot of buyers in the game between 25 and 15.16 where it eventually stopped to rest. I'm sure there were a lot of wannabe shorties out there but with the float on this one being about 6 shares - lots of luck - thank God. My heartfelt (actually I'm laughing so hard snot is pouring out of my nose as I write this) but let me say this - everytime a share is sold someone else buys a share. So someone is stuck with about a million point six shares of this POC and I really really hope it isn't anyone I know - and if it is - no I don't want to go halves with you on a really great investment.

Ok all kidding aside I hope that you were one of the lucky ones who bought on the left side of this mountain and sold on the right side. If you weren't and you are still holding - welcome to the wacky world of "investment" - you just got yourself one Bunky.
I can hardly wait until Monday to see if there will be yet another chapter in the saga of PNTR - road side assistance par excellence.
On Monday and Tuesday it was traded twice - once each day for 200 shares each - On Wednesday it started heating up as a result of earnings. Earnings were - 14 cents per share vs a year earlier where they were -14 cents per share.
Second, for what it is worth, it is an Israeli company that specializes in - road-side assistance. Oh yes, oh yes my kind of company - let me have a bigger piece of pie please - please. - But more importantly - it is below my dollar value cutoff - I try not to play anything below 20 and everytime that I do I always renew my vow to never again play anything below 20. Hope you got that point.
So on a day where there was no action (Friday), someone notices that this little POC is catching a bid and - boom city. All the way to 25 before it collapses.
Interesting enough - the little guy actually set up quite nicely - a standard kiss the EMA 4 and take off kind of set up. See how the stock goes up then slides sideways to the EMA 4? You've seen that set up before on this site.
So had I noticed it would I have played it? Not even if I was playing with your money Bunky - this was a disaster waiting to happen - somebody bought this stock up at 25 points and - boom! Actually a lot of somebodies bought this thing all the way from 15.16 (where it ended) to 25 where it topped and I bet some of them are still sorry today.
That large red blue volume line at 11:30 followed by an even larger red volume line at 12:00 suggests that 11:30 was a "blow-off top" - you've seen those before - on this site.
Unfortunately it didn't collapse all at once - there were still a whole lot of buyers in the game between 25 and 15.16 where it eventually stopped to rest. I'm sure there were a lot of wannabe shorties out there but with the float on this one being about 6 shares - lots of luck - thank God. My heartfelt (actually I'm laughing so hard snot is pouring out of my nose as I write this) but let me say this - everytime a share is sold someone else buys a share. So someone is stuck with about a million point six shares of this POC and I really really hope it isn't anyone I know - and if it is - no I don't want to go halves with you on a really great investment.
Ok all kidding aside I hope that you were one of the lucky ones who bought on the left side of this mountain and sold on the right side. If you weren't and you are still holding - welcome to the wacky world of "investment" - you just got yourself one Bunky.
I can hardly wait until Monday to see if there will be yet another chapter in the saga of PNTR - road side assistance par excellence.
Friday, November 24, 2006
Friday Wraps Up Early
Early day - we didn't do much - added a bit to our GM trade from the other day and began a swing trade in AMD - other than that nothing too exciting.
This was a strange day - started out down then went up then went down again. Goldie (GS) kind of set the tone for the whole day - gapped down nearly $2 at the start, went down from there for the first 15 minutes losing another dollar then turned around an went up for the next couple of hours until about 11:15 when it reversed again finally finishing the day off 19 cents. All three sisters, the ugly stepsister and GS, the proxy for the stock market of the 22nd century finished the last hour in the red - which, believe it or not is a good sign. The VIX pulled way back into the neutral zone and the up/down ratio prints 40%. The new 20 day highs pulled back again but remain above 600 at 672 and the new 20 day lows also pulled back to 135. Believe it or not but all these things together suggest not just an up day on Monday but a strong up day to boot.
The magic coin is 33 and 20 having missed today and for Monday says ... heads - bull market - well we think so too.
Swing Trade - 4
In this one I combined the SMA 200 with the SMA 20 in several variations.
If the Close is:
< 200 > 20 27871
< 200 < 20 4308
> 200 > 20 19994
> 200 < 20 12393
Again this is for 1 trade a day, no more than 4 stocks in the portfolio at any one time, and the holding (swing) period is at least 1 day but no more than 4 days.
The filter requirements are exactly the same as those in Swing Trade - 3.
The obvious winner, again, is when the close is less than the 200 period moving average and less than the 20 day moving average.
If you do decide to use exponential moving averages you are probably going to be a little bit ahead of the average trader - by this I mean the exponential should get you into the trade before the other guy and that is a good thing. It will also get you out before him too and that, sometimes, is even a better thing.
None of these posts are recommendations - do your own due dilligence. Betting, uh, playing, uh, "investing" (wink wink nudge nudge) in the stock market is not as easy as it looks. Trust me - I've got the scars to prove it.
Swing Trade - 3
I combined the EMA 90 with the EMA 21 in several variations. As usual now the results are surprising.
If the Close is:
< 90 > 21 33627
< 90 < 21 8214
> 90 > 21 18888
> 90 < 21 18911
This is for 1 trade a day, no more than 4 stocks in the portfolio at any one time, and the hold (swing) period is at least 1 day but no more than 4 days.
I made one other change to the filter - I took out the requirement for close to be greater than the last close. In other words any stock that meets the moving average requirement and has the highest average volume for that day is the stock that is selected. It doesn't get any simpler than that.
Obviously the best of the four options is when high volume stocks close below the EMA 90 but above the EMA 21. The second best is when they are above the EMA 90 and above the EMA 21. This fits into the pattern suggested by swing trade-2 where the best options were for stocks closing above their EMA 21 and MA 20.
Swing Trading - 2
As promised I looked at some shorter term averages and - wow - that's about all I can say - well I could say some other things but I'm trying to keep this family friendly - if you get my drift.
I used an EMA 21 and an MA 20 - at two different levels of severity - 5% and 8%. The backtesting script remained the same - here are the results -
< EMA 21 5% -144 8% -5721
> EMA 21 7883 855
< MA 20 804 -1067
> MA 20 10754 4676
What this is saying is that being above the short term average is a good thing and that being above the simple 20 period moving average is better than being above the exponential 21 period moving average. That, naturally, is totally different from the findings with the longer term averages.
Wow! Now I have to go and look and see what combining the long and short term averages will do for us. I can hardly wait.
Swing Trading
True to the name of the site we have come up with a couple of new filters - this time for picking trades for swing trading. Simplicity is the key to the very best filters and these two are so simple even a caveman ... never mind that's been used already ---
The basic filter is stocks that close between 20 and 59 dollars and are +/-15% of their 90 day EMA where the most recent close finished greater than the previous days close.
Ok - in layman's terms I am trying to garner a list of stocks that are currently either 15% below their EMA 90 or 15% above their EMA 90. This was based on Dr. Brett Steenbarger's column today regarding the moving average and the fact that the SPX shows much better returns when it is below its 200 day moving average than when it is above. I just used an exponential moving average rather than a simple and individual stocks rather than an index.
I backtested the two filters against the same set of conditions most notably only one stock would be played a day (the highest 90 day average volume stock) and only 4 stocks would be held in the portfolio at a time. Using a 100K bankroll that meant that no more than 25K would be played on any given stock. I set my hold period to no more than 4 days or 10% loss or 15% gain or momentum greater than 2 whichever came first.
The envelope please - in both instances a 77 day period was used (ending on 11/22) which meant that 77 stocks were picked. Of the stocks that began greater than the EMA 90 the end result was a loss of 183 dollars. Of the stocks that began less than the EMA 90 the end result was a gain of 29831 dollars. Big difference.
Then, for fun, I switch the EMA to a simple moving average using 200 as the base. The end result this time for the less than 200 day moving average was 26484 dollars - a small difference. However, for the greater than 200 day moving average the result was 11632 dollars - which is a big difference.
But in both instances Dr. Brett's experiment is supported - you should have better returns with stocks starting from below a long term moving average than with those starting from above. That is a result of regression to the mean.
If I have the time over the weekend I'll try this with a couple of other moving averages - specifically the EMA 21 and the MA 20. Needless to say I could get really classy and start combining long and short term averages and if I don't get too confused I might try it.
I used Stockfetcher.com for my filtering and backtesting software. Different date ranges and exit settings will necessarily yield different results.
Wednesday, November 22, 2006
Wraps a Wednesday
Good day - but I missed most of it - including an opportunity to sell GM a dollar higher than where I did sell it. I think it has bottomed and I re-bought it at the close for a swing trade. Otherwise I was out most of the day.
For Friday it will probably be more of the same since it is a short day. The up/down ratio is 50%, the VIX is back to neutral, the new 20 day highs added a few to 854 and the new 20 day lows took off a few to 182.
The three sisters and the ugly stepsister and the proxy for the 22nd century all finished strong and white in the last hour. I think that all the above means an up day on Friday.
The magic coin adds another and prints 33 and 19 and for tomorrow ... heads - bull market continues - who believes a magic coin.
Tuesday, November 21, 2006
Tuesday's Wraps
I already discussed the trades of the day - including the one I should have taken in place of the one I did take - but that's today and there is always tomorrow. Speaking of tomorrow it will probably be just like today. The up/down ratio is 50%, the new 20 day highs increased again by about a 100 and new 20 lows stayed in the low 200's. The VIX remains only about 5% below its 10 day MA. But the three sisters, the ugly stepsister and the proxy for the 22nd century all finished in the last hour white. It looks to me as if it will be a low volatility day as everyone is making their break for the seashore.
The magic coin racks up another win today and gets to 32 and 19. For tomorrow it says ... heads - bull again - probably will.
The magic coin racks up another win today and gets to 32 and 19. For tomorrow it says ... heads - bull again - probably will.
I Kid You Knot
Believe it knot I missed KNOT again. How can one person be so dense? Here it is - see if you can pick up the trade without my annotations to get in the way.

I did play AMR for a bit and closed my ATHR trade for a nice profit - then I blew it all on GM - still holding a handful of shares 80 cents under water - thankfully I didn't take a major position. It might work out OK in the next couple of days - we'll see.
I did play AMR for a bit and closed my ATHR trade for a nice profit - then I blew it all on GM - still holding a handful of shares 80 cents under water - thankfully I didn't take a major position. It might work out OK in the next couple of days - we'll see.
Gap-Up Play
I don't play many gap-ups but I do look for them because they have a distinct set up formation. On Monday however I missed an excellent gap-up in KNOT. Here is what that looks like in the 30-minute version.
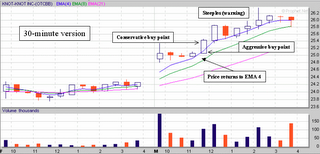
You can see that I use the EMA's 4, 8 and 21 - I used to use the simple moving averages but I have found that the exponentials suit my trading style and so I prefer them. Note that this is a preference only - others prefer the SMA - to each his own. In this set up there is a gap-up of indeterminant range. The next one to three candles slide sideways until the price returns to the 4 EMA. From there it is just a waiting game. I have put two entry points on the chart - an aggressive one which is the one I usually take and a more conservative one - again to each his own. Later in the day you start seeing steeples and, with the village in sight, it is time to think about ending this trip. That should come with the second to last candle if not the last.
Interestingly enough on 30-minute charts there is yet one more entry opportunity right after the large red candle but I would consider that to be a dangerous place because it is afternoon. Some people play then - I don't normally start trades in the afternoon.
Because we don't mess around in this Blog here is the same trade except on a 15-minute basis.
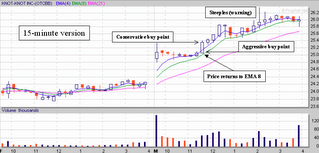
This one is actually showing you a dummy spot (that little red Doji in the 4th candle. If the next candle was a substantial hammer it would have been the entry point but it wasn't so we continue waiting for the set-up to develop.
Basically the entry and exit points are about the same but there is one critical difference between 15-minute and 30-minute set-ups - see it? That's right - on the 15-minute chart the price should return inside the 4 EMA and almost or actually touch the 8 EMA. Again there are two normal buy points - one conservative and one aggressive. And once again when you start seeing the steeples you are approaching the village and it is time to start thinking about ending the journey.
Once more there is a tertiary entry point around 1 P.M. right after that red Doji (dummy spot) that hit the 8 EMA. I consider this to be a little less dangerous entry than the one shown on 30-minute charts but only because of the fact that it is a Doji, it is rebounding from the 8 EMA, and it is followed by a hammer.
It is important to note that while set ups appear equivalent across time frames there is usually a little something that is different. For example the difference between the 4 and 8 EMA's. Now you won't always see that effect but I like to see it because it raises the probability of the trade being a success in my process.
Again all charts from prophet.net with annotations done in power point (thanks Mr. Softee) and based on set ups that I first learned from the King - Trader X. He probably wouldn't recognize these but everyone has their own methods that keeps them in the comfort zone.

You can see that I use the EMA's 4, 8 and 21 - I used to use the simple moving averages but I have found that the exponentials suit my trading style and so I prefer them. Note that this is a preference only - others prefer the SMA - to each his own. In this set up there is a gap-up of indeterminant range. The next one to three candles slide sideways until the price returns to the 4 EMA. From there it is just a waiting game. I have put two entry points on the chart - an aggressive one which is the one I usually take and a more conservative one - again to each his own. Later in the day you start seeing steeples and, with the village in sight, it is time to think about ending this trip. That should come with the second to last candle if not the last.
Interestingly enough on 30-minute charts there is yet one more entry opportunity right after the large red candle but I would consider that to be a dangerous place because it is afternoon. Some people play then - I don't normally start trades in the afternoon.
Because we don't mess around in this Blog here is the same trade except on a 15-minute basis.
This one is actually showing you a dummy spot (that little red Doji in the 4th candle. If the next candle was a substantial hammer it would have been the entry point but it wasn't so we continue waiting for the set-up to develop.
Basically the entry and exit points are about the same but there is one critical difference between 15-minute and 30-minute set-ups - see it? That's right - on the 15-minute chart the price should return inside the 4 EMA and almost or actually touch the 8 EMA. Again there are two normal buy points - one conservative and one aggressive. And once again when you start seeing the steeples you are approaching the village and it is time to start thinking about ending the journey.
Once more there is a tertiary entry point around 1 P.M. right after that red Doji (dummy spot) that hit the 8 EMA. I consider this to be a little less dangerous entry than the one shown on 30-minute charts but only because of the fact that it is a Doji, it is rebounding from the 8 EMA, and it is followed by a hammer.
It is important to note that while set ups appear equivalent across time frames there is usually a little something that is different. For example the difference between the 4 and 8 EMA's. Now you won't always see that effect but I like to see it because it raises the probability of the trade being a success in my process.
Again all charts from prophet.net with annotations done in power point (thanks Mr. Softee) and based on set ups that I first learned from the King - Trader X. He probably wouldn't recognize these but everyone has their own methods that keeps them in the comfort zone.
Tech Leads
Well this is just the old diagram of the three sisters and the ugly step sister (IWM) updated to the 20th of November but as I was looking at this this morning it suddenly occurred to me what I was looking at - good old fashioned tech leadership in a bull rally!
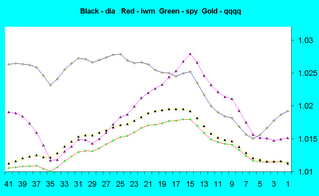
"Old fashioned" - right. Anyway for you purists out there this is the proof that the bull rally is for real (at least this week's version of it). A couple of other things to note - IWM is flattening out and finally rolling over. While barely perceptable the ticks in the IWM line are closer together than they were a week ago. Another thing to note is that the SPY is finally crossing over the DIA so maybe the major market will participate to the end of the year now that the INDU has had its day in the sun.
I don't know but I thought this stuff was interesting. You can go back to sleep now.
Monday, November 20, 2006
Crazy Wrapping Monday
What a day - I didn't feel right all day so all I did was manage my "investment" (ATHR) and I sold it in early afternoon for a 50 cent gain (over the 14 cents I was down on Friday). Then later it set up again and I bought it again and now I'm plus 13 cents and hoping for another gap up tomorrow. This is a crazy game.
On Friday I said that the market was going up today and, I don't know, but if two of the three sisters go up, the ugly step sister goes up and the proxy for the market of the 22nd century goes up and if only the dumb old Dow Jones Industrials went down did the market go down? (Of course I'm talking about the ETFs DIA, SPY, QQQQ, and IWM above and not the indices they reflect.) (And why "of course" because if I wanted to I could play the cash market using those elements and that's what I'm all about - playing.) GS didn't make the 2 handle like I thought it would - maybe later this week or early next.
Yes, the market went up - it tried to go down in mid-afternoon off a housing report. But seriously who here didn't know that housing was in trouble? Obviously the entire trading community that's who - they started selling with both hands when the report came out. Morons.
Tomorrow - more of the same. Why? Because the up/down ratio edged back up to 45%, the new 20 day highs went to 668 from 575 and the new 20 day lows stayed about where they were at 212. The VIX, although it printed a single digit handle this evening still remains only about 6% below its 10 day MA and all the sisters, the ugly step sister and the proxy of the 22nd century all finished with strong white candles in the last hour. Put it all together in Thanksgiving week and you've got low volume trading in stocks that are barely going anywhere.
The magic coin loses another and now sits at 31 and 19 and for tomorrow --- heads - bull market - probably.
Sunday, November 19, 2006
Farming
Michelle B on Trader Mike writes about finding a niche - I put it differently - I say you need to look at your trading as if you were farming. You put in a couple of crops and watch them grow. A farmer doesn't grow every possible vegetable in the world, he grows what his particular land will carry and what he knows about. You really can't go from tomatoes to potatoes you know, at least not in bulk. First place even though tomatoes will grow just about anywhere you really do need special soil for potatoes - sandy with very little clay is about right. Otherwise you'll be growing marbles and don't worry if you don't know why - it really doesn't matter. Point is you need to specialize not only in the type of trades you will take but what you will trade in. You need to find your comfort zone.
I only like to play on the long side of the market - first I know that method and second the bias of the market is long. While I could adapt my methods to play the short side my head nor heart would be in it and I would fail. It would be awful to be making money on the long side and giving it away short. Also I have enough trouble finding stocks to take a position in on the long side - I can't imagine what it might be like going short.
For catching potential longs I developed a couple of screens that look for gap downs and gap ups and what I found after several weeks is that the same stocks were always coming up on my screens. Apparently stocks have a personality and some of them can't go up unless they first dip down and some can't go up unless they gap up to start then dip down. So after awhile I just made a list of the common elements and what some would call a watch list I call my "farm".
I play stocks from that list more than any others because I know how they react in various market conditions. Of course it isn't the stock that is reacting but the traders of that stock who are reacting and I know their moves. I know when a certain candlestick formation sets up what will happen next with a high probability of success. So just like a farmer who knows how much a given field will yield given a certain mix of fertilizer and water I know how my fields will behave given a certain mix of price and volume.
And I find that both comfortable and profitable. The best part of this is when a field is played out I know that too and can then look for a new crop to farm.
Technical Analysis 101
My reader (thanks Mom) wants to know if I remember saying that all technical analysis sucks? – Actually I do but I was talking about all the stuff that is related to manipulating moving averages (and simple moving averages at that) such as rate of change, momentum, and so on. But as I say –just because I don’t like it doesn’t mean I don’t know how to use it.*
My basic problem with most TA is that too many people rely too heavily on it to the exclusion of ever knowing what they are doing. I know this because I was once one of those people. I became a much better trader once I started taking the various programs apart and looking at all of their moving parts. After I did that I began to understand what all these squiggly lines was trying to say. Unfortunately a lot of what they were saying I already knew just by looking at the price patterns and once I realized that - well the rest is history.
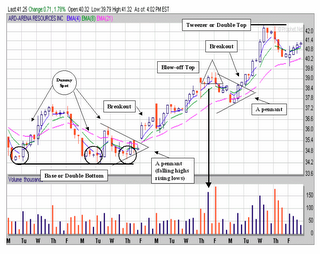
As my reader knows I use a lot of candlestick based TA and I like a breakout from congestion as much as the next guy. Anyway I was looking through some charts this morning in my favorite format, which is 2-hour increments and I came across this one – ARD. A quick glance revealed that it was a veritable clinic in pennants, and dummy spots and tweezer tops and double bottoms and so on. It also had a crisp example of a blow-off top on Thursday before last – which is something you don’t see very often unless you are looking for it.
The blow-off top is characterized by one huge buying push (by volume) followed by a Doji (or what I call a steeple) most often in red followed by a huge volume red candle of any kind. We also had a tweezer top in this particular formation just in case you didn’t get the significance of the rest of it. I call that long necked candle a steeple because in the old days the church steeple was always the highest point in the village and if you think about it – that’s what this signifies.
Anyway for your viewing pleasure complete with markups and everything else you once had to pay for but now can get for free – I give you Technical Analysis 101. (Charts as usual from prophet.net – an excellent site).
One more lesson - if TA is going to work it has to work across all time frames and it must work consistently across all time frames. Much of what passes for TA these days only works well on closing prices and any attempt to use it on a shorter frequency might lead to your early demise as a trader. Be careful.
* (Actually Tom Selleck’s character said it in the movie Quigley Down Under. And he was talking about a .45 caliber wheel gun.)
My basic problem with most TA is that too many people rely too heavily on it to the exclusion of ever knowing what they are doing. I know this because I was once one of those people. I became a much better trader once I started taking the various programs apart and looking at all of their moving parts. After I did that I began to understand what all these squiggly lines was trying to say. Unfortunately a lot of what they were saying I already knew just by looking at the price patterns and once I realized that - well the rest is history.
As my reader knows I use a lot of candlestick based TA and I like a breakout from congestion as much as the next guy. Anyway I was looking through some charts this morning in my favorite format, which is 2-hour increments and I came across this one – ARD. A quick glance revealed that it was a veritable clinic in pennants, and dummy spots and tweezer tops and double bottoms and so on. It also had a crisp example of a blow-off top on Thursday before last – which is something you don’t see very often unless you are looking for it.
The blow-off top is characterized by one huge buying push (by volume) followed by a Doji (or what I call a steeple) most often in red followed by a huge volume red candle of any kind. We also had a tweezer top in this particular formation just in case you didn’t get the significance of the rest of it. I call that long necked candle a steeple because in the old days the church steeple was always the highest point in the village and if you think about it – that’s what this signifies.
Anyway for your viewing pleasure complete with markups and everything else you once had to pay for but now can get for free – I give you Technical Analysis 101. (Charts as usual from prophet.net – an excellent site).

One more lesson - if TA is going to work it has to work across all time frames and it must work consistently across all time frames. Much of what passes for TA these days only works well on closing prices and any attempt to use it on a shorter frequency might lead to your early demise as a trader. Be careful.
* (Actually Tom Selleck’s character said it in the movie Quigley Down Under. And he was talking about a .45 caliber wheel gun.)
Saturday, November 18, 2006
Marlyn's Curve - Revisited
We've used the Marlyn's curve on the site to demonstrate a number of points - some I'm sure you've agreed with and others - well are you going to believe your lying eyes or not? But I want to emphasize that Marlyn's curve is used in the most part for information, to inform, and not as a trading device unless you know what you are doing. Even then it is only a sentiment indicator no better nor worse than any other - the only difference being by using Marlyn's curve I can compare two disparate stocks and make decisions regarding one or the other of them just based on the comparison. You've seen this a number of times on the site. For example I've shown you how the RYDEX funds compete with one another and how oil and airlines work together (or against one another) and in a recent post - how the Dow theory might not be all that it is cracked up to be. Today I'd like to discuss the curve as a trading tool and explain the components.
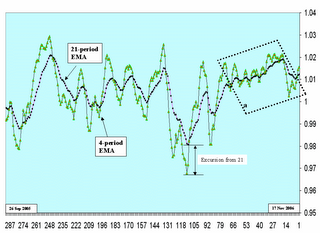
For comparisons any simple moving average will work and I usually use the 20-period moving average of the 20-period normalized returns for that purpose. But for trading I like to kick it up a notch (as somebody famous usually says - love that spaghetti sauce by the way) and use the EMA's of the 20-period normalized returns. Someday when I have the time I'm going to test a method where I normalize the returns using and EMA but for now it is a simple method. Anyway looking at the picture what we see is that part I showed recently (in the dotted box) that shows why we day traders have been having such a hard time this summer and fall.
Recently we had a nice downturn for a bit and now it appears that the INDU is turning back up again. I use two averages in conjunction like this so I can understand what is happening in the near and intermediate term simultaneously.
The 21-period EMA is used to determine overall market sentiment. I.E. what is the trading community at large feeling about the market as a whole. I generally wait for three days to decide whether the market is turning up or down after a major turn. This is why the last 80 days or so have been so difficult - every 3 days the sentiment changed. It whipped back and forth in a directionless manner for weeks and weeks even though it was generally going up. I think this was a result of the transportation average being off so far. Traders who believe in the Dow theory were trying to beat the market down but the dynamic of the market in a totally hedged environment is up up up. I'm talking in global generalities now because when you talk about something as large as the market you really only can generalize.
But again the evidence in box a is overwhelming in its message. We have just gone through an extremely unusual period in the market and - are you ready for this - nobody noticed. At least nobody who makes a living with a blog or on TV. But even if they had noticed the story is so difficult to tell with their primitive tools they simply couldn't tell it. Even I can't really tell it because it is all after the fact. I can only point backward and say see - that's what happened.
I use the 4-period EMA to inform my trading. I watch it as it runs away from the 21-period and when it gets to a certain point it generally turns. This "certain point" is not some hard and fast value - I just start getting ready as the difference grows.
I use this also in my daily trading where I watch the excursion of the EMA-4 away from the EMA-21 and if certain candles start forming when that difference seems excessive - I close the trade.
The other thing that happens when the market direction changes is the momentum starts slowing. Note that you can see this in the major curve by the fact that the ticks get closer together. Then when the market is running the ticks get further appart. See how in the directionless period the ticks never separated by much at all. Again this is a feel or a sensation not a hard fast measurement. I suppose I could average it but then it becomes institutionalized as a metric and most metrics are absolute crap. This would be one of those.
The other interesting thing is that the major curve pretty much stays between .98 and 1.02 or a 2% maximum excursion from 0. But that's another useless metric that you needn't put any stock into.
The only value of Marlyn's curve other than being able to compare issues is to show the sentiment of the market as a whole and to kinda sorta halfassed predict turns - and that's it. But isn't that the story of most TA?
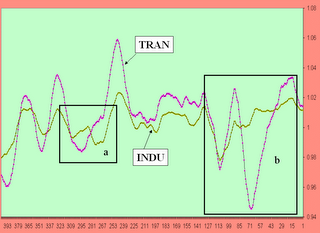
Dow Theory
The Dow theory is simple as can be - whither the transportation index there the Industrials. In other words one doesn't move without the other and if they do the earth stands still and everything that we know and love turns to ....
Not so. In general the tranny's and the indu's track together and play nice and as the following chart shows for the past two years that only two times on a global basis did they diverge - once briefly, box a, and once tremendously, box b.
I know, I know what you are saying to yourself right now - "where in the hell does he get such ugly colors," but seriously, can we be serious for a moment -
As shown in box a when the INDU's realized that the TRAN's were going up they rushed to catch up. But box b is most interesting because this was what was happening that many of the bobbleheads and blogheads (many instances same difference) were talking about this past summer - you know as the Dow was making a run at a new record how - "The trannies are crashing! The trannies are crashing! The world as we know it must come to an end." And it didn't.
Point being kiddies who're ya gonna trust - the bobbleheads or your own lying eyes?
Stop worrying about things like the Dow theory - it obviously doesn't work as some folks want it to. It might have used to done that back when buggy whips were all the rage but apparently in the age of microsoft it don't work that way so much no more. And despite the horrendous grammar - you get the point.
Not so. In general the tranny's and the indu's track together and play nice and as the following chart shows for the past two years that only two times on a global basis did they diverge - once briefly, box a, and once tremendously, box b.

I know, I know what you are saying to yourself right now - "where in the hell does he get such ugly colors," but seriously, can we be serious for a moment -
As shown in box a when the INDU's realized that the TRAN's were going up they rushed to catch up. But box b is most interesting because this was what was happening that many of the bobbleheads and blogheads (many instances same difference) were talking about this past summer - you know as the Dow was making a run at a new record how - "The trannies are crashing! The trannies are crashing! The world as we know it must come to an end." And it didn't.
Point being kiddies who're ya gonna trust - the bobbleheads or your own lying eyes?
Stop worrying about things like the Dow theory - it obviously doesn't work as some folks want it to. It might have used to done that back when buggy whips were all the rage but apparently in the age of microsoft it don't work that way so much no more. And despite the horrendous grammar - you get the point.
Friday - Itsa Wrap
Lately nothing has been able to keep the Dow Industrials down. It poked its head above the close line around 12:30 as we predicted would happen. NASDAQ was down but not by much and the Q's actually closed on yesterday's number. The Q's are still returning more (on average) than IWM by the way and I will let you know when that changes.
This morning right out of the box I took a quick shot at a newbie called ID. This was written in my notebook and I didn't know why so I took a look at about 10 to 10 and it was up strong. Given the market was sort of floundering around at the time I took a position and 15 minutes later sold it for a 30 cent profit. If everyday was like that I'd be in heaven. Unfortunately after a short break helping out the wife on a project I returned and about the time the market started turning I saw an old friend - ATHR. Now ATHR as we pointed out in an earlier post was not a particularly good set-up and I am still holding ATHR because I think the market is going to go up on Monday and take ATHR with it. So it is no longer a trade but now it has risen to swing-trade status or, an investment - too bad it doesn't pay a dividend.
The market is going up on Monday you say - how do you know - well despite the obvious (rule 1 - nobody knows nothing including me) the up/down ratio is printing 42%, there are 575 new 20 day highs which is 400+ less than yesterday and even though the new lows are weak at 214 there is a new reason for that.
When the new lows stay low when the new highs pull back it means that the market is in a consolidation mode. What you want to avoid are really low new highs coupled with really high new lows as that means the market is on its way down. I think. As with everything else you read on this site keep in mind you don't know nothing either even after you've read this stuff.
The VIX is proving to be, as usual, less useful on the bottom as it is on the top and I need to take a closer look at that. I think we can use the VIX as a measure of trader sentiment and right now that is mellow - only because I hate the word "complacent" - fact is we passed complacency weeks ago and are in some world of trading nirvana where absolutely nothing is wrong and will stay that way for a long long time. Whatever dude.
What else - oh yes the three sisters (and for those new these parts they are DIA, SPY, and the ever lovely QQQQ) all finished the last hour strong white, as did the ugly step sister (IWM) and Goldie (GS) (the proxy for the market of the 22nd century) finished with a white doji - that means "I'm sorry I went down today - please buy me and I'll print a 2 handle on Monday."
So barring some freaking catastrophe that's my take.
The magic coin returns to its winning ways and now stands at 31 and 18 and for Monday .... tails - bear - who wants to listen to a stupid magic coin anyway? Only has a 63% chance of being right. (Based on past performance and as you all know in a binary situation the actual probability of any outcome is 50% regardless of the dumbass premise behind it - or you better know that at least).
I'll be back later this weekend with some other neat stuff I've been thinking about.
Friday, November 17, 2006
Blow-Off Bottom - Once More with Feeling
The last two examples were from Wednesday here are two examples from today.
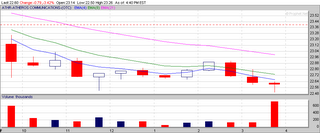

This however is a trick because only one of these qualifies as a Blow-off bottom. If you guessed INTC you would be correct. Now guess which one I played today - that's right ATHR which I turned into an investment. I'm only 14 cents to the bad and it will go up on Monday.
The key to the blow-off bottom is the amount of volume and the shape of the candlestick. It must be a red hammer or hammer-like with good volume. Now - take a look at the 3rd and 4th candles on INTC and recall the lesson in Candletricks earlier. If I were to merge these two candles (which I could because they fit together nicely) they would form a nice large hammer-like object with good volume. Then the next candlestick, the white hammer-like object says, buy me, buy me oh please buy me.
Of course, I bought ATHR which fits none of the rules. I could have made a little on it but I wanted a lot and the drop on the third candle from the end came suddenly (indicated by low volume and large movement). As I said it's now and investment and Monday will see the end of it.
Blow-Off Bottom - Again
Yet another great example of a blow-off bottom. 30-minute chart of CVNS. I didn't play this one either but it is such a beautiful example I couldn't not show it to you.
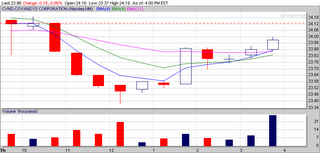
Candletricks
Years ago when I first learned about candlesticks I learned how to combine them to make two sticks act as one. A good example of this came up on Wednesday. Here is how SPY looks through Thursday. The candlestick on Wednesday (B) appears to be an inverted hammer which ocassionally suggests a top.

But if you combine Tuesday (A) and Wednesday (B) you get a large spinning top formation which suggests that the market really doesn't know what it wants to do which is obvious from Thursday's action. If you saw it on paper it would look like this -
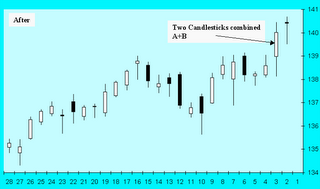
But of course you would do this in your head, you wouldn't really see it on the page.

But if you combine Tuesday (A) and Wednesday (B) you get a large spinning top formation which suggests that the market really doesn't know what it wants to do which is obvious from Thursday's action. If you saw it on paper it would look like this -
But of course you would do this in your head, you wouldn't really see it on the page.
Pre-Friday Market - Expiration Day Blues
Looks like a down day - at least until the first shares are sold at the open. Right now (08:30 A.M. EST) the FTSI-100 is red, futures are red and the NASDAQ pre-market indicator is red. I believe that probably suggests a down opening.
But this is expiration day so there is also a good possibility that around noon the market will be turning around and drifting up again - that's if it opens down in the first place.
I will play in my usual way - take a set of gap downs and gap ups at 10 A.M. then work them for an hour or so to see which way the wind is blowing and if I can find a trade - go for it. I try to get 20 of each and if my net catches too many I only take the top volume stocks. I know I'm probably missing some good opportunities but, hey, this is working and I have a simple rule - keep it simple, if something works don't fix it.
Anyway we'll see you later with a new original post that I will call "Candletricks" - watch for it - you will be amazed and astounded, or something.
Thursday, November 16, 2006
Blow-off Bottom
We've talked about blow-off bottoms before. They happen to be my absolutely favorite kind of trade. First they are extremely obvious on just about any time frame, second, they can occur either on a gap up or a gap down (but more prevalent on gap downs) and third, they result in high probability trades. Here is CVNS - I've played this one before and did not play it today but I was looking through my watch lists after the market closed and this stood out like a sore thumb. This is being played on the 30 minute charts and note what happened with the 6th bar - it formed a high volume red hammer. Unfortunately I wasn't paying attention at the time and didn't see it.

The 30-minute charts provide slow developing set ups that, once established, will last for some time. While you could have picked this up from the 15-minute charts it is more crisp and obvious from the 30's. This is why many of our contemporaries prefer the 30-minute charts.

The 30-minute charts provide slow developing set ups that, once established, will last for some time. While you could have picked this up from the 15-minute charts it is more crisp and obvious from the 30's. This is why many of our contemporaries prefer the 30-minute charts.
Thursday's Wrap
Bad storms today so I didn't get to play my usual round of golf - oh well. Made some money though - I played AMR and got a few cents out of it. Sold HANS on the bounce this morning and made some there - bought it back this evening and am going to do it again tomorrow morning. Seems that the only time it goes up is on the open. Sold off glass (GLW) too. I know I said I was going to keep it through the end of the month and I probably should have but I kept worrying about it and when you are worrying about a stock you should sell it. I worry about glass because of the flat screen glut on the market and eventually that is going to result in even more downside (I think) for that stock. If it pulls back again I might take another shot at it. Oh who am I kidding - the next dip and I'm in. As the man says - in a bull market you can only be wrong buying dips on the last one.
Tomorrow is probably going to be a very flat day because it is expiration day and lately the markets don't move on expiration day. But the externals are funny. The up down ratio took 1100 off and is printing 44% which is a huge down from yesterday. The new 20 day highs took 400 off and and the new 20 day lows added 50. The VIX stays overbought and now is more than 6% under its 10 day MA. The three sisters and the ugly step sister all finished the day printing a red candle in the last hour. But GS printed a strong white candle. If I only had a brain I would have put my entire account in GS a month ago and retired today. But I don't. Anyway yesterday I noted that all 5 of these issues finished with a red candle and this morning I went and looked and found out that that generally means a streak of higher highs coming as it doesn't happen that often. I think tomorrow is going up again as there doesn't seem to be anything that can bring it down, not news, not earnings, not anything.
Meanwhile the magic coin has now missed two in a row and that is not good. He's 30 and 18 and for tomorrow he says ... heads - back on the bully bandwagon.
Wednesday, November 15, 2006
Wrapping Wednesday
Market went up - what's new? Fed heads said no new interest rates. Ok - next? I actually lost $236 today. Took a late day position in HANS and it collapsed. But I turned it into an investment - you know the difference between and investment and a trade don't you? An investment is a trade that went South with no stop loss. I'll pitch it tomorrow on the morning bounce. I'm also hold a position in glass (GLW) which I plan to hold through the end of the month.
For tomorrow probably more of the same. As seen this morning we are starting into the Santa Claus rally period of the year. This is the time when all of the funds have to buy buy buy in order to make their numbers look swell and sweet to the hoi poloi so that more and more suckers - I mean - customers will come and buy their wares. Blah blah blah BS BS BS... anyway the three sisters, the ugly stepsister and the proxy for the 22nd century all finished the last hour in the red. I think that means we bounce tomorrow. The VIX continues to stay well below its 10 day average which is not good and the up/down ratio remains in neutral at 4154. Unfortunately 1249 stocks are now at new 20 day highs and only 150 (or half of yesterday's total) are at the low. The last time we had numbers like that the market went up the very next day and then went down for a couple of days. And the time before that and the time before that it did exactly the same thing. So I think the market is going to go up tomorrow and down on Friday - given Friday is expiration day it probably won't go anywhere.
Old magic coin is 30 and 17 having called a bear day for today. But for tomorrow he is saying ... tails again - more bear predicting.
When Last Seen
Here is an update for IWM and the three sisters - last seen 3 days ago. Note the changes = the Q's have actually rolled over and crossed IWM. Meanwhile SPX is attempting to do the same to DIA. Most important however is that the distance between ticks is growing smaller. This indicates that momentum is on its way out of the market and when momentum goes the direction changes. Consequently I would think that we are now going to go into the Santa Claus rally that we seem to enjoy every year.


Tuesday, November 14, 2006
Tuesday Wraps Up
What happened? I go out for a couple of hours and bang look out above - what is going on? Irrational exuberance that's what.
Well I had planned to sit by and watch but when they hand them to you from out of nowhere you have to make the play. The main play was CVNS off a drop that I played as if the first 15 minute candle was a dummy spot. Fact is the drop was from a news report that was totally meaningless. By the end of the day most of the 2 buck drop had been recovered. I was out of it long before that but for a nice profit anyway. I also played GLW and made a small profit, very small. I had CTXS overnight as I mentioned yesterday and for some reason or other - oh yeah because I thought the market was going to collapse today - I sold it off its spike in the first 5 minutes. That's ok, I made some pocket change after commissions.
People say you should post your losing trades - well - when I have them I post them - I'm just not making as many plays any more and I'm trying to adhere to a very successful process. (I'll publish that this weekend if I don't have anything else to say). Anyway as I was saying if I have a loss I'll let you know in the meantime these are my winners.
For tomorrow - I haven't a clue as usual. The up/down ratio sits at 51% which is neutral, the new 20 day highs went up 8 to 766 and the lows went up 9 to 301 - what all that means - your guess is as good as mine. The three sisters finished the last hour in the green. The ugly step sister (who was the first to turn around this morning) finished very strong and GS, the proxy for the 22nd century finished red.
I'm beginning to think that that signal doesn't signal anything. I have to start looking at it and trying to find a correlation somewhere. The VIX finally got into the game and stands now at 5% under its 10-day moving average. If that continues (which I doubt) we might have some trouble on the horizon.
The magic coin, Mr. Majestic, is 30 and 16 having nailed yet another day using just pure plain blind luck - I should be so lucky - for tomorrow ... tails - bear again - maybe, who knows.
Tuesday Warm Up
Well folks, everything I see this morning says going to be a consolidation (sideways) day at best. After yesterday the urge to own may turn into an urge to purge. There is no one thing - it is simply a compendium of "stuff". For example volumes in many individual shares yesterday were out of sight. Increased volume is generally a good thing, blow-out volume is a bad thing - most of yesterday's was blow-out levels coupled with the fact that many issues finished well off their highs. The exceptions (there are always exceptions) were found in the NASDAQ where many tech stocks stayed at their peaks.
Last Thursday there was some kind of mini-bottoming event that I know that I missed and I doubt that very many others saw it. The TICK hit a major low in the 1:30 - 3:30 period and after that the market just sort of loosened up resultint in yesterday's action. Yesterday it did it again in the 11:30 to 1:30 period and that brought the rest of the market to its knees - but not the NASDAQ. And the run up in NASDAQ stocks yesterday was broadbased - in other words most of the index participated.
Currently the FTSI 100 is coming off its highs which doesn't usually happen after a U.S. blow out and the fact is the FTSI was in the red for most of yesterday's session as well. Given that only the NASDAQ actually surged forward yesterday with everything else backing up starting in the 11:30 time frame can only mean one of two things. Either the vaunted NASDAQ tech stock leadership is starting to realize that the parade is way ahead of it and it needs to run to get to the lead or tech stocks are going to have a fire sale today.
I'm opting for door number two because the other piece of bad news of the morning is that the futures are starting to collapse. While I don't put much stock in the futures (bad pun) as a predictor when you put that fact together with the other facts it looks like a good day to sit and watch and I think that's what I'm going to do.
Update 09:00 - apparently all is forgotten - futures have turned around as has the FTSI. This, of course, has to do with the fact that the PPI indicates lower inflation so the Fed won't have to raise any more ever again.
Buy with both hands folks - you won't get another chance like this for at least 24 hours.
Monday, November 13, 2006
Monday Wraps
It was over about 45 minutes into the day the market stopped, went into idle mode and stayed there pretty much the rest of the day. These are not good days for traders unless you happen to find some great pick and ride it for awhile and I didn't. I took a position in CTXS and although it was profitable at the end of the day I decided to hold it overnight and may even go with it as a swing trade for a bit. We'll see. As long as the market keeps doing this (and it has been doing it more often than not) I may just go back to buying at 3:45 and selling at 9:45 the next day - seems as if the only way you get any momentum at all is overnight. Once the market opens everything gaps up and then slides the rest of the day.
Anyway for tomorrow another mixed bag - the up/down ratio sits at 49% or neutral, the VIX remains in neutral, the new 20 day highs pulled back a bit but stayed over 600 and the new 20 day lows add 1 to print 292. The three sisters, the ugly step sister and the proxy for the market of the 22nd century, GS, all finished with a red last hour. I'm beginning to think that that is a good thing.
The magic coin goes up one to 29 and 16 and for tomorrow - heads - another bull day - probably so.
Saturday, November 11, 2006
2 Hour Swing Trade Finder
People who trade for a living know that the day is roughly broken up to the morning session, lunch session, and afternoon session and they are roughly two hour segments. Trading in each segment varies enough that major changes can occur as far as market dynamics but that is a post for another day. I want to talk about using 2-hour charts to inform high probability swing trades.
Many times when you find a trade from a 2-hour chart it can be used for several days running thus it makes a good swing trade finder as well. The two hours go like this 9:30 – 11:30, 11:30 – 1:30, 1:30 – 3:30 and 3:30 to 4. What? - I hear you scream – yes Virginia there are only three 2-hour periods in any given day and the last “2-hour” period is only a half-hour. That’s why the last period is of so much importance – it is the time that is used for book squaring.
If relentless selling continues during that final half-hour of the day you can be pretty sure you are going to have an up day the next day. That’s because the first time the stock shows any change all of those late sellers are going to come flying back. Those late sellers are what we in the business call “suckerfish.” They are either getting out of losing positions or making late day short sales hoping to scalp an overnight gap down. In either instance they are going to be eager to reacquire if they see any movement at all in an upward direction. This is an automatic profit if you are in quick enough.
However, in the other instance where there is evidence that the selling is drying up, I.E. either a dummy spot or NR7 there is a good possibility that the stock will not only go up the next day but also continue to go up over several days. This effect is enhanced if the market at large is also going up during the same period.
Here then are five charts that you could possibly use as models for future swing trade set-ups.
PETM actually bottomed in the second 2-hour trading period, which is indicated by that very clear dummy spot, followed by the doji, which is then followed by confirmation.
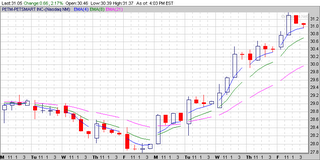
RIO also has a dummy spot this one in the third 2-hour period which is then followed by some suckerfish action which is then scared p-less by the next day’s gap up.
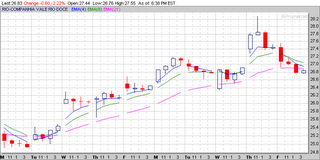
ARD, despite what you might think, only really has the one entry which is the NR7 shown in the first 2-hour period after the relentless selling that went on in the third day in the picture. Remember we always wait for a confirmation before committing funds and there was no confirmation until the candle following that NR7.

AM throws off a dummy spot with a confirmation (third and fourth days pictured) While some selling goes on if you have a stop it should be below the dummy spot on the third day and that is never taken out. The AM trade isn’t finished yet although a lot of folks would have gotten out after that steeple on Tuesday’s first 2-hour period.
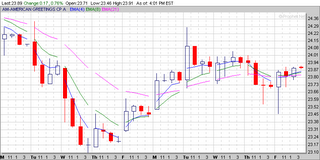
MLS, not only is this a builder but it is a builder of malls and the worst kind of those, mega-malls. Again there was relentless selling including some suckerfish selling on the third day. Imagine the panic when the stock turned around the next day. Obviously a good place to buy since a lot of shorts had to cover. Note the obvious exit at the peak dummy spot on Monday. Next day confirms and you are out.
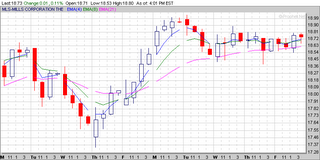
And that's how it is done. Again you always trade at your own risk - what I show here are examples only and are not to be taken as guarantees.
Many times when you find a trade from a 2-hour chart it can be used for several days running thus it makes a good swing trade finder as well. The two hours go like this 9:30 – 11:30, 11:30 – 1:30, 1:30 – 3:30 and 3:30 to 4. What? - I hear you scream – yes Virginia there are only three 2-hour periods in any given day and the last “2-hour” period is only a half-hour. That’s why the last period is of so much importance – it is the time that is used for book squaring.
If relentless selling continues during that final half-hour of the day you can be pretty sure you are going to have an up day the next day. That’s because the first time the stock shows any change all of those late sellers are going to come flying back. Those late sellers are what we in the business call “suckerfish.” They are either getting out of losing positions or making late day short sales hoping to scalp an overnight gap down. In either instance they are going to be eager to reacquire if they see any movement at all in an upward direction. This is an automatic profit if you are in quick enough.
However, in the other instance where there is evidence that the selling is drying up, I.E. either a dummy spot or NR7 there is a good possibility that the stock will not only go up the next day but also continue to go up over several days. This effect is enhanced if the market at large is also going up during the same period.
Here then are five charts that you could possibly use as models for future swing trade set-ups.
PETM actually bottomed in the second 2-hour trading period, which is indicated by that very clear dummy spot, followed by the doji, which is then followed by confirmation.

RIO also has a dummy spot this one in the third 2-hour period which is then followed by some suckerfish action which is then scared p-less by the next day’s gap up.
ARD, despite what you might think, only really has the one entry which is the NR7 shown in the first 2-hour period after the relentless selling that went on in the third day in the picture. Remember we always wait for a confirmation before committing funds and there was no confirmation until the candle following that NR7.
AM throws off a dummy spot with a confirmation (third and fourth days pictured) While some selling goes on if you have a stop it should be below the dummy spot on the third day and that is never taken out. The AM trade isn’t finished yet although a lot of folks would have gotten out after that steeple on Tuesday’s first 2-hour period.
MLS, not only is this a builder but it is a builder of malls and the worst kind of those, mega-malls. Again there was relentless selling including some suckerfish selling on the third day. Imagine the panic when the stock turned around the next day. Obviously a good place to buy since a lot of shorts had to cover. Note the obvious exit at the peak dummy spot on Monday. Next day confirms and you are out.

And that's how it is done. Again you always trade at your own risk - what I show here are examples only and are not to be taken as guarantees.
IWM and Friends
When last we visted the three sisters and their ugly step sister it appeared as if a transition was in the making. Not so fast. It appears to me that the returns are still failing - in other words even though price (which you can't spend) is going up the returns (which you can) are coming down. This always bodes ill for the market at large because it is the returns that cause the market to go up. Hunh? Well if you buy low and sell high you make a profit and you take that profit (which is your return) and you put it back into the market - that, dear child, is what causes momentum. If the return, i.e. your profit is small, you can't put a lot of it back into the market so you don't cause the prices to go up as fast and thus your returns are less. Lesser returns cause people to go to other investments and stocks begin to fall. Eventually the price of the stocks becomes incredibly cheap (in the mind of the investor) and they begin buying stocks again.
This cycle generally takes 40 to 80 days and continues to repeat on a 40 to 80 day pattern forever and ever. Now I don't know why it is 40 to 80 days but that's just the way it is and it probably has to do with short term paper and arbitrage and lots of other nonsense but one thing I do know it doesn't have to do with - the election on last Tuesday. You see elections like earnings are one day events. One day stories. But the business cycle which is what buying and selling stocks is all about is continuous.
Here then are the 4 sisters through November 10 2006
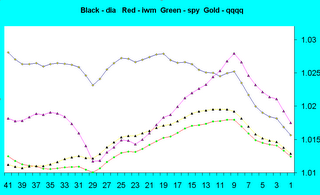
If you count back 4 days (4 ticks on any line) that was election day - the next day there was a huge post Rumsfeld resignation party (although as I noted at the time I don't know why) and then the returns resumed their downward trajectory. This, naturally translates to a directionless market because it really wants to go up at this time of year.
Whenever I Fail
And yes, kiddies, I do fail – not often but 1 out of 5 trades will go sour on me. I have analyzed these failures and in almost every instance it was because of one of two reasons – either I placed my stop in the wrong place by pennies or I was not patient.
Nothing annoys me more than putting a stop in some 50 or 60 cents below the price – going away then coming back and finding that the stop was swept and the stock had gone up a buck in the interim. And this has happens too frequently to be an accident. The worst part is the price might not have been that low – maybe only the bid hit your stop and they took out my trade anyway off the bid being that low for a single instant in time.
Other times the specialist running the stock just dropped down for a minute to sweep all the stock up below a particularly large offer that he had just received and he made instant huge profits as a result. My solution, of course, is to only play well-regarded highly liquid stocks outside of earnings announcements. Although to be honest if an announcement comes that drops your stock - just because you have a stop doesn’t mean crap – you are going to lose anyway. This is something I wasn’t aware of until one day several years ago now I lost 25% of an investment in such a manner and even though I had a stop – tough. If there is no bid at your stop you don’t get to use it. But by playing highly liquid stocks that are generally well regarded you really don’t need a hard stop so most often I don’t use one.
But the biggest problem is patience – part a - I get impatient with trades that just sit so I close them out only to watch them go up immediately thereafter. Or, part b - I see a trade that drops down a little and I panic and close it out only to see it go back up.
The solution to part a - if a trade isn’t losing money then it shouldn’t be closed – Doh!
For part b - if the trade does drop if it was played properly it probably will bounce off the EMA right below it and shouldn’t be closed until it clearly passes through that EMA. In other words wait for the price to tell you to close and don’t just close arbitrarily. In almost every instance a stock’s price will bounce after it goes down which will permit you to get out nearly even if not a little bit in the black. You must keep this in mind as you trade and not adopt a doom and gloom scenario to everything.
Now I know that I said in almost every instance this is why I fail by which I mean that 2 out of 3 of my failures are due to the above. The third instance of failure is almost always - I jumped in too soon and didn't let the set-up develop. That is easily solved - follow the process!!!!
Two Hours to Tombstone
Ok – it wasn’t a movie – but it is an apt title for a process that looks at 2-hour charts to find bottoms. I’m going to show you three examples starting with one that contains a little dummy spot. After a period of relentless selling as shown on the 2-hour charts it is always a good idea to watch the opening hour or so the next day. If you see some movement in the opposite direction you probably have a winning trade developing even in the absence of any traditional set-ups. I call this selling exhaustion. Now some people would say well I could look at the RSI or other momentum indicator and see that to which I respond – maybe, maybe not. In fact of the three examples I will show here not a one of them printed an RSI below 25, at least not on the 2-hour charts.
First up – DHI. This is a homebuilder, and builders as you know have been beat up mercilessly over the past several months. However, every once in awhile a buyer or two steps in and starts to grab up shares. This usually happens right after some heavy selling. Here is what that looks like –
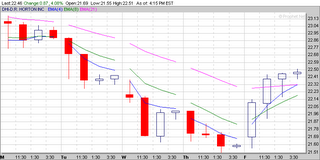
That little candlestick in the final position on Thursday is an actual “dummy spot”. When you see that the next move is generally up.
The next day on the 15-minute charts you can see that DHI gaps up a bit then loops down then takes off for the sky. Because of the gap up and the dummy spot on Thursday this would have been a good stock to watch for just this type of move on Friday.

I know Sally, I wish I'd had it too.
The next example is just relentless selling. No dummy spot, NR7 or any other indicator – GS was just being hammered down on Thursday. So on Friday what happens but a gap up and the rest is history. Again – in the face of relentless selling as seen on Thursday for this, a generally well-regarded stock, it pays to keep it on the watch list and if you see a change in direction, scoop some up.
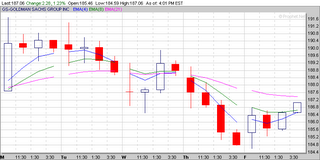
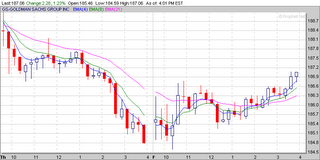
The final example is one of my favorites, HANS. And this one is exactly the same as GS – relentless selling all the way into the close. The next day however there is a gap up and a very clear indicator (hammer) that the direction for the day is going to be up – up - up. I took a position off the confirmation second bar and held nearly to the top. Lucky me.


One way to make this work is to do some after hours or pre-market work and find a list of stocks that have gone down that day or preferably over several days. Then view them on two hour charts and see how they did it. If they were stone cold drops they might be plays but are risky. But if they show relentless selling over the course of the day you might want to watch them the next day.
Once more props to prophet.net - the excellent charting service that I use. I don't get anything from them so go on over there and take a look. You might like their site.
First up – DHI. This is a homebuilder, and builders as you know have been beat up mercilessly over the past several months. However, every once in awhile a buyer or two steps in and starts to grab up shares. This usually happens right after some heavy selling. Here is what that looks like –

That little candlestick in the final position on Thursday is an actual “dummy spot”. When you see that the next move is generally up.
The next day on the 15-minute charts you can see that DHI gaps up a bit then loops down then takes off for the sky. Because of the gap up and the dummy spot on Thursday this would have been a good stock to watch for just this type of move on Friday.
I know Sally, I wish I'd had it too.
The next example is just relentless selling. No dummy spot, NR7 or any other indicator – GS was just being hammered down on Thursday. So on Friday what happens but a gap up and the rest is history. Again – in the face of relentless selling as seen on Thursday for this, a generally well-regarded stock, it pays to keep it on the watch list and if you see a change in direction, scoop some up.

The final example is one of my favorites, HANS. And this one is exactly the same as GS – relentless selling all the way into the close. The next day however there is a gap up and a very clear indicator (hammer) that the direction for the day is going to be up – up - up. I took a position off the confirmation second bar and held nearly to the top. Lucky me.
One way to make this work is to do some after hours or pre-market work and find a list of stocks that have gone down that day or preferably over several days. Then view them on two hour charts and see how they did it. If they were stone cold drops they might be plays but are risky. But if they show relentless selling over the course of the day you might want to watch them the next day.
Once more props to prophet.net - the excellent charting service that I use. I don't get anything from them so go on over there and take a look. You might like their site.
The NR7
Yesterday I printed a picture of the Q's on the hourly chart and showed clearly how a doji in the last hour could translate to a rising market the next day. The "doji" shown, of course, was not a classic doji and I should have been more precise in identifying the pattern as a "narrow range 7" or NR7. The NR7 has been around for a long time as an indicator of a change of direction. I sometimes call it a "dummy spot" but again that wouldn't be as precise in this instance.
The NR7 is simply the narrowest range bar in the last seven regardless of the frequency being used. Whenever you come across the NR7 be careful. The direction of movement is probably going to change. Now the really observant reader will have already seen that there are actually two NR7 bars on this picture. One at the end of the day on Thursday and one at the top of the range on Thursday. You see a narrow range bar is the narrowest of the last seven and the last seven can include a narrow range 7 bar. Don't think about it for too long - your head will explode - just appreciate the power of the NR7. As an extra credit question can anyone guess why it is so powerful?

That's right - the buying or selling is drying up and the market is resting and preparing for a new move in a different direction. Good Ferris - you can stay after class and clean the erasers. The rest of you - dismissed.
The NR7 is simply the narrowest range bar in the last seven regardless of the frequency being used. Whenever you come across the NR7 be careful. The direction of movement is probably going to change. Now the really observant reader will have already seen that there are actually two NR7 bars on this picture. One at the end of the day on Thursday and one at the top of the range on Thursday. You see a narrow range bar is the narrowest of the last seven and the last seven can include a narrow range 7 bar. Don't think about it for too long - your head will explode - just appreciate the power of the NR7. As an extra credit question can anyone guess why it is so powerful?
That's right - the buying or selling is drying up and the market is resting and preparing for a new move in a different direction. Good Ferris - you can stay after class and clean the erasers. The rest of you - dismissed.
Friday, November 10, 2006
Freaky Friday Wrapper
As promised another directionless day of meandering around looking for a reason to exist. But enough about me, the markets weren't much better. Another mixed ending to a mixed up day - the three sisters (DIA, SPY, Q's), the ugly stepsister (IWM) and the proxy for the 22nd century (GS) all finished strong white in the last hour.
But the up/down ratio returned to neutral (52%), the VIX stayed in neutral, the new 20 day highs jumped over 600 and the new 20 day lows pulled back to 291. This is a market headed nowhere fast. The bias remains up but the dynamics say - IDunno.
Interesting enough the Q's were up all day today and that was off the doji at the end of yesterday. Here is what that looks like -
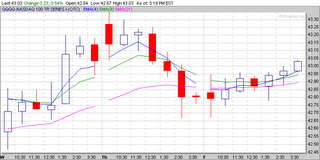
When you see this in a 60-minute or 2 hour chart you can be pretty sure you are looking at a bottom and the next day if not the next several days will have an upward trajectory.
Not being one to make such statements lightly I plan to be back this weekend with several examples including the one I played today - what else - HANS.
Well the magic coin is 28 and 16 having nailed today and even though it was not a boomer it still was up up up so it gets the bull nod. For Monday the coin says ... heads - another bull day. I think so too. Might even be a real bull day.
Friday Pre-Market
The other day (Wednesday) I mentioned that the FTSI 100 was in the red and that usually foreshadowed a down day in the U.S. markets - it started out that way and then Don Rumsfeld resigned (read: was fired) and the stock market took that as a good thing - although I don't know why. On Thursday it sobered up and realized that having an incompetent asshole as the head of the military was a good thing and now, although the new guy is just as incompetent, it won't be a smooth transition. In fact there might be some adult supervision over the various billions and billions of dollars being pissed down the rabbit hole so defense-based profits might dry up a bit.
The fact is, because of Iraq, all other defense dollars have dried up and the only place where any money is being spent is directly on the war effort and a tremendous amount of that is being used for trying to repair the children who have been hurt so bad during their tour of duty. So believe it or not once the current defense contracts are spent out and spent out they will be there is no more money to either refresh them or start new ones. And in two years, just in time to blame the Democrats in the next election cycle, the country is going to be in a deep, deep recession. You read it here first. So maybe Karl Rove isn't so incompetent after all - and if you don't think he hasn't already thought this through you are wrong wrong wrong wrong - wrong wrong wrong wrong. Did I mention you're wrong.
Back to the task at hand which is wither the market this glorious morning and wither is probably up. The futures appear to be signalling thus and the FTSI 100 which was deep red awhile ago might transition to green. If it does I think we will have another one of those directionless days we have grown to love these past several months. Here is what that looks like in case you don't know.
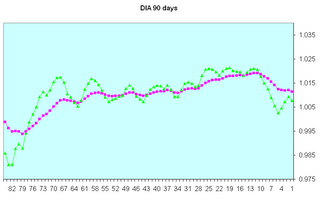
The red line is the 20 day exponential average of the returns of the DIA and the green line is the 5 day EMA of the same. You see how only recently has the 5 day pulled very far away from the 20 day. This is unusual enough to be remarkable. Here is the same figure except the last 290 days are shown.
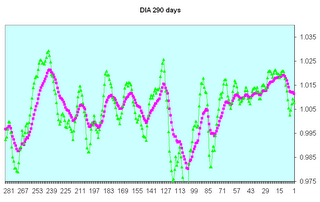
See how it looks in a more normal manner - the 5 day has a more or less large excursion from the 20 day and the 20 day has some marked ups and downs. When the market has a direction and purpose a trader can make money - when it doesn't you can't - it's that simple.
The fact is, because of Iraq, all other defense dollars have dried up and the only place where any money is being spent is directly on the war effort and a tremendous amount of that is being used for trying to repair the children who have been hurt so bad during their tour of duty. So believe it or not once the current defense contracts are spent out and spent out they will be there is no more money to either refresh them or start new ones. And in two years, just in time to blame the Democrats in the next election cycle, the country is going to be in a deep, deep recession. You read it here first. So maybe Karl Rove isn't so incompetent after all - and if you don't think he hasn't already thought this through you are wrong wrong wrong wrong - wrong wrong wrong wrong. Did I mention you're wrong.
Back to the task at hand which is wither the market this glorious morning and wither is probably up. The futures appear to be signalling thus and the FTSI 100 which was deep red awhile ago might transition to green. If it does I think we will have another one of those directionless days we have grown to love these past several months. Here is what that looks like in case you don't know.

The red line is the 20 day exponential average of the returns of the DIA and the green line is the 5 day EMA of the same. You see how only recently has the 5 day pulled very far away from the 20 day. This is unusual enough to be remarkable. Here is the same figure except the last 290 days are shown.
See how it looks in a more normal manner - the 5 day has a more or less large excursion from the 20 day and the 20 day has some marked ups and downs. When the market has a direction and purpose a trader can make money - when it doesn't you can't - it's that simple.
Thursday, November 09, 2006
Thursday Wraps
Wow - finally a down day. It had to happen sooner or later and I'm so glad it was today - I went and played golf today so no real damage. But now I see that there has been a change in the dynamic. The up/down raio prints 34% the new 20 day highs have pulled back to 572 and the new 20 day lows (the more important) have gone forward to 504.
The DIA and SPY both finished in the white the Q's printed a doji and the IWM finished strong. Only GS printed strong red but that's ok for now - it needed a rest.
I anticipate an up day tomorrow.
The magic coin missed another one and sits at 27 and 16 and for tomorrow says ... heads - bull market.
We'll see.
I'll be back before the market opens tomorrow with another update of Marlyn's curve and the three sisters and IWM - the ugly step sister.
Wednesday, November 08, 2006
Wednesday Wraps Up
I know you are asking yourself when will this market go down? Well, obviously the answer is never. It looked like we might get a needed drawback this morning then Don Rumsfeld cut and run and boom - for some reason or other the market said that's good news let's go up.
I will not give up - for tomorrow the up/down ratio is once again totally neutral it can't get any more neutral than 50% - this suggests that nobody knows what the market might do. Then the new 20 day highs put on over 100 today to 835 and the new 20 day lows took away 18. This suggests that while people continue to buy overbought stocks they are afraid to sell them.
The three sisters are mixed 1 red, 1 white, 1 doji while the ugly stepsister (IWM) finished a strong white and the proxy for the 22 century - GS - finished red. That's as mixed as it's going to get.
This all sums up to an up day tomorrow but for the life of me I don't know why.
Meanwhile the magic coin loses another one and prints 27 wins 15 losses but it doesn't give up either - for tomorrow ... heads - bull market.
The Effect of Elections on the Stock Market
None. It, just like every other story is a one day event. The market will go up or down - it always does. The sky won't fall the seas won't part and we will (probably) not see the second coming before nightfall. The country is going into recession or not - no political party since the beginning of time has been able to figure out how to change the business cycle. There is simply too much money involved.
While the Federal Government commands a great amount of money the impact of the Federal Government on anything other than war and pestilance since the great depression of 1929 has been minimal. That's because there is so much more money in the economy right now that the Federal Government doesn't stand a chance.
So when you hear the bobbleheads all repeating today's soon to be favorite litany about the "market not liking uncertainty" stand up, turn around, point your posterior at the TV and drop trou - because that is the only respect that that analysis deserves.
Wednesday Pre-Market
My favorite pre-market indicator the FTSE 100 is trading deep in the red - I think that presages a down - down - down day in the U.S. markets. Now the moron bobbleheads on bubblevision are going to tell you that it is a reaction to the election - you say that's a bunch of B.S. because Marlyn said it was because there isn't much out there left to buy - everything is pretty much overbought and we need a correction.
The Importance of the 90
The 90 period EMA that is - if you don't know what and exponential moving average is I suggest you look it up. On the following charts (2 year weekly) the blue line is the 90 period EMA and the red line is the 200 period simple moving average. If you can't tell just by looking how important the 90 EMA is to understanding what a stock is doing then you need more than your eyes examined.
So when people start talking about the 200 period this or the 200 period that tell them to take 90 and get real.
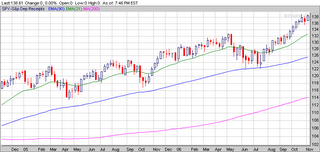

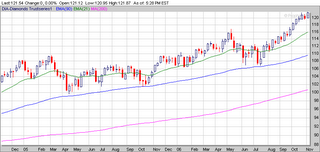
The other average shown (in green) is the 21 period EMA. I use that average as a gauge to determine whether the stock will be a candidate for reversion to the mean. Whenever it gets too far away from the 90 it seems to want to scurry back. Of course, "too far" is a nebulous term that can mean just about anything. If you watch the stocks for awhile you can pretty much judge what "too far" is just by eye.
So when people start talking about the 200 period this or the 200 period that tell them to take 90 and get real.
The other average shown (in green) is the 21 period EMA. I use that average as a gauge to determine whether the stock will be a candidate for reversion to the mean. Whenever it gets too far away from the 90 it seems to want to scurry back. Of course, "too far" is a nebulous term that can mean just about anything. If you watch the stocks for awhile you can pretty much judge what "too far" is just by eye.
Tuesday, November 07, 2006
Wrapping Tuesday in a Bow
Another day another round of golf- I'm glad I skipped out on today - it went up but I think it's done. Here's why -
The up/down ratio is at 49%, but there are 776 new 20 day highs and only 235 new 20 day lows, the three sisters finished the last hour in the red as did the ugly stepsister (IWM) and the 22nd century proxy for the market - GS. The VIX is so cowed it refuses to move from day to day. Tomorrow - down - down - down.
Meanwhile magic coin makes a new win going to 27 and 14 and for tomorrow - tails - bear in the air.
Monday, November 06, 2006
Monday Wraps It Up
Wow. What a day - I missed most of it. Had an appointment this morning and by the time I got back it was over. Everything was at its high of the day and nothing was coming off the floor - including HANS which gapped down severely this A.M. on an excuse. The excuse? That options backdating thing that's been going on. So far HANS is the only stock affected in this manner (severe drop) and they are only going to be investigating - no one has said that they actually had a problem. Thus it is an excuse not a reason. The institutions holding HANS wanted a reason to get out. How do I know? Almost double volume. Then there was no buying once it found a floor. Might be I've lost another momo stock and have to go fishing again. We'll see.
For tomorrow --- the three sisters all finished the last hour in the red as did the ugly step sister (IWM) as did the 22nd century proxy for the market - GS. Unfortunately the VIX didn't move, the new 20 day highs only increased by 17 and the new 20 day lows increased to over 600. The up/down ratio remains in neutral. You would think in such a booming economy that stocks would generally go up - well only some of them did.
This is truly a mixed message but I'm going out on a limb and suggest that tomorrow is going to be a down day because it is needed. I might be wrong but as I'm fond of saying - it doesn't matter because I'm going to play golf.
The magic coin is 26 and 14 because it called for a bear day and it obviously wasn't. For tomorrow the coin says ... heads - bull run again.
See you tomorrow after the market closes.
Regression to the Mean
The one area of TA that I can't fault (aside from pure old supply and demand) is the theory regarding regression to a mean. I've seen it so many times that I know it is the truth - when one average strays far enough away from another average the other average acts as an attractor and pulls it back. The same thing could be said about raw price but raw price is so volatile most often that you will have a difficult time trying to figure it out.
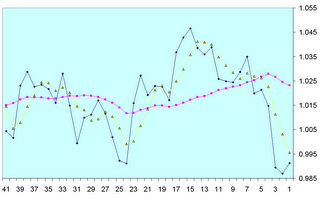
Above is a picture of IWM, the black line is the normalized returns over the period selected, the yellow line is the 4 period average of the black line and the red line is the 20 period average of the black line. You don't have to be a rocket scientist to be able to figure out why IWM closed up on Friday - it was getting too far away from its 20 day average. Now the only problem with that statement is - how far is too far? Well we really don't know - all we can really say is that given 2% difference between averages price is going to react - most of the time. And you can take that to the bank.
Above is a picture of IWM, the black line is the normalized returns over the period selected, the yellow line is the 4 period average of the black line and the red line is the 20 period average of the black line. You don't have to be a rocket scientist to be able to figure out why IWM closed up on Friday - it was getting too far away from its 20 day average. Now the only problem with that statement is - how far is too far? Well we really don't know - all we can really say is that given 2% difference between averages price is going to react - most of the time. And you can take that to the bank.
Subscribe to:
Posts (Atom)
