And I'm out of here - everyone have a great life.
Marlyn Trades
Saturday, June 30, 2007
Sunday, June 10, 2007
Cross Overs Are The Key
If your chart doesn't show the 4, 8 and 21 EMA then go fix it - I'll wait. We'll get to the reason why in a little while.
I have spent an inordinate amount of time over the past several weeks looking for something that I've already found - the best method to swing trade stocks when you are working is the cross over pattern. Put your stop (mental or actual) below the candle that crossed and let them run.
Some examples -
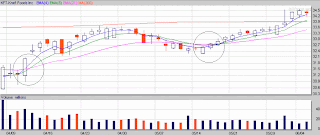
We'll start with Kraft Foods (KFT) - two crosses in two months - both profitable. Note that I have the MA 200 drawn on some of these charts - I'll use that later to show you something that might be important.
I don't particularly care for the first KFT cross over (which is actually the second in 4 days) simply because it has too much thrust. I prefer the kind like that on 5/16 because it is a more gentle ascent. Although both were profitable the second one is actually a lot better and may not be done yet.
Exiting a cross over is up to you - I expect 3% to 5% and after that everything is golden. My stop is always just below the crossing bar because the beauty of the cross over is - it works or it doesn't. I use a close as a trigger to sell the stock. In other words an intra-day move below the candle will not cause me to sell but a end of day close below the candle definitely will. While some folks have studied it and think that a pull back is OK I prefer the ones that go straight up.
Note that a cross over must open below the EMA 4, 8 and 21 and close above them. I do permit a composite (across two days) cross but to be honest I prefer those that happen all in one day. No hesitation normally means that the stock is going to go up.
Here is Natural Gas Services Group - NGS.

Another stock with two cross overs showing - the one on 4/25 was almost a failure but no candle closed below the cross over. However, if you missed the first one the second one had to ring a bell somewhere. You can see this one takes a normal trajectory - up, sideways, up, sideways - and that is the mark of a healthy advance. The last several days are almost saying - sell me - I'm done. I wouldn't be surprised to see a pull back next week. Which is just fine since we are well over the 5% gain at this time.
For the cultists - here is Microvision - (MVIS)

Another stock with two cross overs in two months - the first one being a composite. You can see by the price action after the composite that the traders weren't too sure about this one and let it slide to the 4 before taking it up again. Then it hit a patch of 4 days down. Any stock that goes red for 4 days in a row becomes suspect in my book and you can see that after the next three days it posted a cathedral of dead money on 4/05 and that would have been a good time to dump it.
MVIS put another cross over in play on 5/17 and has done pretty well since then although that "cross on the hill" that it printed on Friday suggests that it is going to back out some more.
The question of the hour is - why would anyone play any of these stocks without a cross over? - Most likely the answer is - impatience. And impatience is the reason why many traders go broke instead of rich.
Here's another - Nutrisystems - NTRI

NTRI was obviously a great buy on 3/15 when it crossed over. That was a nifty 42% ago. And that's the power of the cross over. Will they all come up that high that fast? Not necessarily but enough of them will that you can make some nice money just for being patient.
Here's another one that I bought - Live Nation - LYV

The cross over on 5/30 was followed up by a nice jump in price. And I sold it on Thursday at end of the day.
Now here's one more - I told you the 200-period moving average would show up again -

Two cross overs and the first one closed over the MA 200 and it came back down. It didn't close below the crossing bar however so the trade could have remained in place. But after a couple of false starts it crossed over below the 200 and took off - coincidence - probably - but who knows. I'll play cross overs either side of the 200.
Now here's why you need to have the EMA 4, 8 and 21 - while I have tried just about every other combination and method of moving average known to man these three averages test the best for cross overs. I haven't tried MA 50 or 20 or 200 and for all I know those averages are perfectly fine for this purpose and if they are - great. But I like the fact that these three averages vary in their relation to one another in a manner that suggests - volatility. When the averages converge it suggests that volatility is damping out and when they diverge it suggests that the volatility is excessive and needs to come back.
So instead of looking at the three averages as just three more lines on a chart - start looking at them as a function of volatility and they might start making more sense to you.
They have to be EMA you know because only EMA has the sensitivity to the price that is necessary to become a proxy for volatility.
I'm working on a filter that measures the variance of the three averages and then uses the ATR as a base to determine if I can find a better measure of volatility than Bollinger's amazing Bands. The variance of the average for those of you who want a real challenge is the averages difference with itself day to day and then comparing the three differences with each other to see if a rationale statement of fact can be made in regard to the discrete events. I have a feeling that that should be the subject of yet another post (if it pans out).
I'm now using several different cross over filters - but they are all just riff on the main one which is
Now here's a little secret although how it could be a secret I haven't a clue but here goes anyway - pick any 100 stocks, put up a 3 month daily chart for each of them and most, if not all will show at least one cross over in that time period. For proof I offer the A's and B's of the NASDAQ tech 100.

You can do the rest.
The asterisk on BBBY says that there were many failed cross overs for this stock - fortunately I'm not a big fan of BBBY either as a business or a stock so no matter. The double asterisk on BIIB says that there was a cross over on 5/17 that failed 2 days later. On 5/21 BIIB crossed again profitably.
You might also note that AKAM and APOL both crossed on Friday. Not a recommendation - just an observation.
That's all for this week end - I've got to get back to my research - so much to do so little time to do it.
I have spent an inordinate amount of time over the past several weeks looking for something that I've already found - the best method to swing trade stocks when you are working is the cross over pattern. Put your stop (mental or actual) below the candle that crossed and let them run.
Some examples -

We'll start with Kraft Foods (KFT) - two crosses in two months - both profitable. Note that I have the MA 200 drawn on some of these charts - I'll use that later to show you something that might be important.
I don't particularly care for the first KFT cross over (which is actually the second in 4 days) simply because it has too much thrust. I prefer the kind like that on 5/16 because it is a more gentle ascent. Although both were profitable the second one is actually a lot better and may not be done yet.
Exiting a cross over is up to you - I expect 3% to 5% and after that everything is golden. My stop is always just below the crossing bar because the beauty of the cross over is - it works or it doesn't. I use a close as a trigger to sell the stock. In other words an intra-day move below the candle will not cause me to sell but a end of day close below the candle definitely will. While some folks have studied it and think that a pull back is OK I prefer the ones that go straight up.
Note that a cross over must open below the EMA 4, 8 and 21 and close above them. I do permit a composite (across two days) cross but to be honest I prefer those that happen all in one day. No hesitation normally means that the stock is going to go up.
Here is Natural Gas Services Group - NGS.

Another stock with two cross overs showing - the one on 4/25 was almost a failure but no candle closed below the cross over. However, if you missed the first one the second one had to ring a bell somewhere. You can see this one takes a normal trajectory - up, sideways, up, sideways - and that is the mark of a healthy advance. The last several days are almost saying - sell me - I'm done. I wouldn't be surprised to see a pull back next week. Which is just fine since we are well over the 5% gain at this time.
For the cultists - here is Microvision - (MVIS)

Another stock with two cross overs in two months - the first one being a composite. You can see by the price action after the composite that the traders weren't too sure about this one and let it slide to the 4 before taking it up again. Then it hit a patch of 4 days down. Any stock that goes red for 4 days in a row becomes suspect in my book and you can see that after the next three days it posted a cathedral of dead money on 4/05 and that would have been a good time to dump it.
MVIS put another cross over in play on 5/17 and has done pretty well since then although that "cross on the hill" that it printed on Friday suggests that it is going to back out some more.
The question of the hour is - why would anyone play any of these stocks without a cross over? - Most likely the answer is - impatience. And impatience is the reason why many traders go broke instead of rich.
Here's another - Nutrisystems - NTRI

NTRI was obviously a great buy on 3/15 when it crossed over. That was a nifty 42% ago. And that's the power of the cross over. Will they all come up that high that fast? Not necessarily but enough of them will that you can make some nice money just for being patient.
Here's another one that I bought - Live Nation - LYV

The cross over on 5/30 was followed up by a nice jump in price. And I sold it on Thursday at end of the day.
Now here's one more - I told you the 200-period moving average would show up again -

Two cross overs and the first one closed over the MA 200 and it came back down. It didn't close below the crossing bar however so the trade could have remained in place. But after a couple of false starts it crossed over below the 200 and took off - coincidence - probably - but who knows. I'll play cross overs either side of the 200.
Now here's why you need to have the EMA 4, 8 and 21 - while I have tried just about every other combination and method of moving average known to man these three averages test the best for cross overs. I haven't tried MA 50 or 20 or 200 and for all I know those averages are perfectly fine for this purpose and if they are - great. But I like the fact that these three averages vary in their relation to one another in a manner that suggests - volatility. When the averages converge it suggests that volatility is damping out and when they diverge it suggests that the volatility is excessive and needs to come back.
So instead of looking at the three averages as just three more lines on a chart - start looking at them as a function of volatility and they might start making more sense to you.
They have to be EMA you know because only EMA has the sensitivity to the price that is necessary to become a proxy for volatility.
I'm working on a filter that measures the variance of the three averages and then uses the ATR as a base to determine if I can find a better measure of volatility than Bollinger's amazing Bands. The variance of the average for those of you who want a real challenge is the averages difference with itself day to day and then comparing the three differences with each other to see if a rationale statement of fact can be made in regard to the discrete events. I have a feeling that that should be the subject of yet another post (if it pans out).
I'm now using several different cross over filters - but they are all just riff on the main one which is
show stocks where close is between 15 and 35
and average volume(90) > 500000
and open < ema(21)
and open < ema(8)
and open < ema(4)
and close > ema(21)
and close > ema(4)
and close > ema(8)
and close > open
and close 3 days ago < ema(21)
and close 5 days ago < close 3 days ago
and close 5 days ago < ema(90)
and add column atr(10)
and sort on column 5 ascending
Now here's a little secret although how it could be a secret I haven't a clue but here goes anyway - pick any 100 stocks, put up a 3 month daily chart for each of them and most, if not all will show at least one cross over in that time period. For proof I offer the A's and B's of the NASDAQ tech 100.

You can do the rest.
The asterisk on BBBY says that there were many failed cross overs for this stock - fortunately I'm not a big fan of BBBY either as a business or a stock so no matter. The double asterisk on BIIB says that there was a cross over on 5/17 that failed 2 days later. On 5/21 BIIB crossed again profitably.
You might also note that AKAM and APOL both crossed on Friday. Not a recommendation - just an observation.
That's all for this week end - I've got to get back to my research - so much to do so little time to do it.
Saturday, June 09, 2007
Taking Advantage
Trading is about taking advantage of any edge you can find. We were given a gift this week and I hope some of you took advantage of it.
The gift was three down days in a row. And solid down days they were too. After the third day the up/down ratio sat at 17% and when it gets that low everyone knows that the market is oversold to a fault. The second thing that everyone should know is that the 401K money started coming in around Wednesday or Thursday.
So with an influx of must-use cash and an oversold market what are the odds that we have an up day on Friday? That's right - about a gazillion to one and we did - hope you didn't bet against.
I whipped together a quick filter on Thursday night in honor of the event - I called it 3 Days Up
Notice two things - first I deviated from my normal 15 - 35 and second I dropped my volume requirement by 400000. My rationale was this - I wanted to catch stocks that were swimming up stream against the current and I wanted them to be small stocks. In other words I wanted the stocks that institutions were buying for their 401K clients. This is, of course, an entirely different aspect of analysis and I won't get into it at the present but it is something I've been watching for awhile and I will write about it someday - but not now.
Anyway this filter, as simple as it is, tests very nicely - 66% win percentage, 1.91 reward/risk and 80% ROI compared to the SPX of 1.54% ROI for the same period.
It is also the kind of filter that you could use to pick day trades in an oversold market because these stocks weren't sold - they were bought.
And here are the 9 picks it made for Friday morning with a column showing how those stocks did during the day on Friday. Because of the tenuous nature of the open on Friday - just about any of these could have been bought before they made their run.

I've annotated the results to indicate how you might have rationalized a buy of the several winners and you can look up the charts yourself.
I gave IRIS a cross over but it wasn't on the 15-minute chart but rather on the 10 minute. I don't normally switch time frames myself but some people do as a matter of course.
So out of 9 picks you could have played 7 with only one loss. RDWS would have paid off because you would have been buying it below open and the result is as of Thursday's close.
Bottom line - take advantage of what the market gives you. Keep the week of the month in mind - we all know that this week and next is 401K week and the following week is options week and the market behaves pretty consistently regardless of its overall direction in accordance with those hard and fast facts.
And if you get another 3 days down in the future - don't forget 3 Days Up.
More later about cross overs.
The gift was three down days in a row. And solid down days they were too. After the third day the up/down ratio sat at 17% and when it gets that low everyone knows that the market is oversold to a fault. The second thing that everyone should know is that the 401K money started coming in around Wednesday or Thursday.
So with an influx of must-use cash and an oversold market what are the odds that we have an up day on Friday? That's right - about a gazillion to one and we did - hope you didn't bet against.
I whipped together a quick filter on Thursday night in honor of the event - I called it 3 Days Up
show stocks where close is between 12 and 20
and average volume(90) > 100000
and close 2 days ago > close 3 days ago
and close 1 day ago > close 2 days ago
and close > close 1 day ago
Notice two things - first I deviated from my normal 15 - 35 and second I dropped my volume requirement by 400000. My rationale was this - I wanted to catch stocks that were swimming up stream against the current and I wanted them to be small stocks. In other words I wanted the stocks that institutions were buying for their 401K clients. This is, of course, an entirely different aspect of analysis and I won't get into it at the present but it is something I've been watching for awhile and I will write about it someday - but not now.
Anyway this filter, as simple as it is, tests very nicely - 66% win percentage, 1.91 reward/risk and 80% ROI compared to the SPX of 1.54% ROI for the same period.
It is also the kind of filter that you could use to pick day trades in an oversold market because these stocks weren't sold - they were bought.
And here are the 9 picks it made for Friday morning with a column showing how those stocks did during the day on Friday. Because of the tenuous nature of the open on Friday - just about any of these could have been bought before they made their run.

I've annotated the results to indicate how you might have rationalized a buy of the several winners and you can look up the charts yourself.
I gave IRIS a cross over but it wasn't on the 15-minute chart but rather on the 10 minute. I don't normally switch time frames myself but some people do as a matter of course.
So out of 9 picks you could have played 7 with only one loss. RDWS would have paid off because you would have been buying it below open and the result is as of Thursday's close.
Bottom line - take advantage of what the market gives you. Keep the week of the month in mind - we all know that this week and next is 401K week and the following week is options week and the market behaves pretty consistently regardless of its overall direction in accordance with those hard and fast facts.
And if you get another 3 days down in the future - don't forget 3 Days Up.
More later about cross overs.
Friday, June 08, 2007
I'm Sorry
I think I owe all of the happy holders of GOOG a big apology and that guy I ripped up last month for buying GOOG for all of his clients - I apologize from the bottom of my - wait a minute - let's look at this from a technical perspective. I present GOOG -

and, as you can see there was a big ol' cross over on 5/16 and I don't know how many times I've written about cross overs on this site but I do know it's been more than once. So - seeing that cross over if you didn't jump aboard the GOOG express then you have no one to fault but your... - wait a minute - let's look at this from yet one more perspective -
Had you owned GOOG on 4/23 and seeing this -

An AAPL cross over and had you remembered what I said back in April that AAPL would see 90 before it saw 100 and that it was coming off of 90 and had you sold your GOOG shares on 4/23 you could have bought 5 AAPL shares for every GOOG share you owned on that date.
But let's say, for the sake of argument that you kept your GOOG shares instead of selling them and GOOG has gone from the 480 where it was on that date (4/23) to 515 where it finished today you would have earned - 7% plus. On the other hand, had you sold your GOOG on that date and bought 5 AAPL shares for every share of GOOG that you sold you would have bought AAPL at 94 and today you would be looking at 32% appreciation except that you would own 5 times the number of GOOG shares and that would mean that in comparison to GOOG you would have gained 160% on your GOOG money.
Maybe I'm not sorry after all for telling people to dump the albatross and to use cross overs as a buying indicator. The most powerful indicator there is - a cross over unless it is a cross over that is following a BOB.
Sunday, June 03, 2007
Buying In a Market Boom
The most difficult thing in the world is to trade during market booms - yes you can day trade and be successful as long as you stay within the constraints of a few hours. But the trading community is so skitterish during market run-ups that they are ready to sell and buy (in that order) anything on just about any news.
I wrote this on stockbee awhile back (I still like that guy) and it was so simple and profound I thought I'd open the BLog and repost it here: Buying all time highs or other high mark is a sucker's play - yes every once in awhile you will make some coin (witness GOOG which traded at all time highs for several months and then, suddenly, stopped and is now just so much dead money).
But many times you will be the bag holder in a very bad trade (PNTR comes to mind immediately - put up a 1 year chart of PNTR and imagine the guy who bought at 24).
Never buy a stock unless you have two numbers in mind - both exits - one above the price you paid and one below. If you hold above the upper number be ready to dump if it retraces to your target and never hold below your lower number.
If you follow that simple approach you can buy any stock at any price at any time. Remember learning how to trade is learning how to lose - anybody can learn how to win - it's the losing that is troublesome.
If you adhere to that last paragraph and just apply some selection discipline you can make money in any kind of market - up or down.
Stockbee has a number of methods that he uses to buy stocks that have retraced some from their all time highs. This is known as buying stocks in the Trader's Action Zone (TAZ) which is highlighted on Taz Trader's site where you can also pick up some great tips for trading. Both of these sites are on my link list.
Come back about once a week because I'm working on a method whereby wage slaves such as myself can still short-term trade with only one or two visits to the market every day. Eventually I'll get it and I will publish it here.
Tuesday, May 22, 2007
Monday, May 21, 2007
The Last Wrap
As they say - all good things must come to an end and most bad ones too. I've been putting this off for a few days and I can no longer delay the inevitable.
When I retired I never stopped working I just did some other things such as trading full time. I've made a living trading on a daily basis, I've learned over the several years that I've done it how to do it. In the beginning I made every mistake known to man and a few more besides. What I've learned is that a couple of simple approaches done over and over again will make a lot of money in today's market. Cross overs, BOBs, pivot points, RSI(2), and ATR(10) have been my life for several years now.
I spent my working years in the service of my country – first because I didn’t know what I wanted to be when I grew up (still don’t) but then, eventually, because it became important. The result of that misspent youth is that I possess some skills that are not that readily available among the general population and because of that I have been called once more to serve my country.
Oh - how I wish it were that noble. Truth of the matter is a friend of mine has a unique job that I can do and I said yes. The hours are long, the work is excruciatingly boring, the rewards are great, and the pay is excellent. Hey – that sounds like trading! It isn’t.
The problem is I have to discontinue Filteringwallstreet. That’s because the nature of the job doesn’t provide the time to do the background work necessary to write the posts.
I'm going to miss this. Trade smart and always remember Rule 1 – nobody knows nothing – including me.
Goodbye friends.
Sunday, May 20, 2007
NR 7
The NR 7 is a very potent candlestick - what NR 7 means is narrowest bar in last 7. And that means that the trading community will probably change directions on the next bar.
Here is SAI from Friday -

Many of the packages on the market that will observe intraday candles will pick out the NR 7 candle for you and send you an alert. For that reason those particular packages are probably worth their weight in gold.
I don't particularly play that trade unless it pops up on one or more of the stocks that I follow regularly - then I will take it. The reason for that is that I feel more comfortable with my farm than I do with new candidates that I haven't observed in action.
The way to play an NR 7 is simple - if the stock has been declining (and it can be used in the Return to 4 method) buy the stock on the breakout of the next bar and put your stop below the NR 7. If you see it form an NR 7 and you own the stock it is probably time to sell.
That's Strange
I just noticed that comments are not turned on for the post "Is Technical Analysis Worthwhile?" - I don't know why that is or how to correct it - so if you want to comment to that post - comment here
Testing - Composite Cross Over II
In the previous post I combined linear regression slope with the cross over filter to see what would happen. Recently stockfetcher added fundamental analysis features to their filtering capabilities and I tried combining Beta with the cross over filter v6.
Beta is the amount the stocks price varies from a baseline index. If the price has more momentum than the baseline then beta is greater than 1, if it has less then the beta is less than 1.
I had always thought that high beta were better stocks to buy. And they are but only when the stock is ascending. In general though low beta stocks have the best returns. The test was simple - back test stocks where beta > 1 and where beta < 1. Here are the results.

One day I intend to run this test over a number of different periods, but for the current period these results are just fine.
I then added a line to the cross over v6 filter that said "and Beta < 1" and tested that. Then I change the line to greater than 1 and test that. Here are those results

Once again the original filter is the better filter but cross over candidates where the beta is < 1 seem to have a better ROI and 30 day net than those where the beta is greater than 1.
So that is one more way that you can look at composite results - using the results to inform between selections if you have a lot of selections on any given day.
Now I haven't tried a linear regression slope plus beta filter - maybe I will someday.
Testing - Composite Cross Over
Many times I like to add some complexity to my simpler filters to see what would happen if...
Today I was looking at the cross over filter v6. That looks like this -
And I added a line to the filter which contained a constraint for the linear regression slope - that looked like this
After testing the 45 day version I tried the linear regression slope less than 0 for a 15 day period and a 30 day period. And then I changed the less than 0 to greater than 0 -
And tested every version in that configuration and here are the results

What this shows is that the original cross over v6 has a good win percentage, a good short term (4 day) ROI and a good 30 day net change. It also has a good number of selections. None of the other filters quite matched or exceeded these results in total. But there are some things to learn from this.
If you want a filter that doesn't pick many stocks but those that it picks have a high probability of winning with a great reward to risk factor and a super ROI then you would use the linear regression slope for 30 days greater than 0.
On the other hand while the filters where the linear regression slope was less than 0 did not match the original, they weren't too awfully bad either. That suggests that maybe combining the LRS with the cross over isn't such a good idea but maybe the LRS less than 0 has some promise either on its own or combined with another good filter.
Something to think about - something to look into.
Today I was looking at the cross over filter v6. That looks like this -
show stocks where close is between 15 and 35
and average volume(90) > 500000
and open < ema(21)
and open < ema(8)
and open < ema(4)
and close > ema(21)
and close > ema(4)
and close > ema(8)
and close > open
and close 3 days ago < ema(21)
and close 5 days ago < close 3 days ago
and close 5 days ago < ema(90)
And I added a line to the filter which contained a constraint for the linear regression slope - that looked like this
and linear regression slope(45) < 0
After testing the 45 day version I tried the linear regression slope less than 0 for a 15 day period and a 30 day period. And then I changed the less than 0 to greater than 0 -
and linear regression slope(45) > 0
And tested every version in that configuration and here are the results

What this shows is that the original cross over v6 has a good win percentage, a good short term (4 day) ROI and a good 30 day net change. It also has a good number of selections. None of the other filters quite matched or exceeded these results in total. But there are some things to learn from this.
If you want a filter that doesn't pick many stocks but those that it picks have a high probability of winning with a great reward to risk factor and a super ROI then you would use the linear regression slope for 30 days greater than 0.
On the other hand while the filters where the linear regression slope was less than 0 did not match the original, they weren't too awfully bad either. That suggests that maybe combining the LRS with the cross over isn't such a good idea but maybe the LRS less than 0 has some promise either on its own or combined with another good filter.
Something to think about - something to look into.
Is Technical Analysis Worthwhile?
As we've already noted in this BLog the global answer to that question is - oh hell no - but, and there is always a "but" - any trader who is making a living at trading who can't look at three candlesticks and "guess" the direction of the market for the next three candlesticks with at least 65% accuracy isn't going to continue making money. And 65% accuracy is better than "guessing" and 65% accuracy over a stream of 3 discrete events is far better than guessing.
For example here is SBUX and my guess today is that SBUX has had enough of the down side and will, market forces permitting, turn up for the next three weeks at least.

What does "market forces permitting" mean? It means if the market as a whole goes up then SBUX should go up.
And where is the market as a whole going? According to SPY - up

Why am I guessing "up" - because there is only one other way to guess and it has more letters in it.
No - not really - I'm guessing up because the SPY weekly chart shows a return to 4 over the past 4 weeks. You can see that 4 weeks ago the open was above EMA 4 and the close was above the open. The following week repeated that pattern. The following week moved sideways and last week the open hit right on the EMA 4. That is a return to 4 pattern and that pattern always means that with a 65% probability the market will be higher three weeks from now. Which means SBUX will, with 65% probability be higher three weeks from now.
CROX on the other hand will not be.

Oh my God, Amy, I can hear you blubbering over here. But, but, but, but - you sound like an old motor boat - just look at the chart and tell me what you see --- that's right a stock that has run away from its base - the EMA 4. So my guess is that CROX needs a rest and will go sideways-down for the next three weeks (return to 4) - after that - who knows - those candlesticks haven't been printed yet.
The CROX chart has a lot of interesting items on it. First is the cross over back in July '06 and if you bought it there as I would have advised at the time (had I seen it then) you would be several hundred percent to the good right now.
It did a return to 4 in Oct and posted a "cathedral of dead money" in the second week of November. (The Japanese literature calls that an evening star). Regardless of what it is called - that that would have been a good place to sell because that's when the funds did. This would have been followed by a reacquisition in the first week of January off the BOB that formed in December.
In November/December do you think that was basing, consolidating, or resting? I'm going to opt for the "Christmas-holidays-end-of-the-year-mutual-fund-tape- painting-and-reacquisition-because-we-must-have-CROX-in-our-fund-
going-into-the-New-Year" formation that is so popular among the TA crowd. (Although I'm pretty sure it isn't called that).
It did another run away from the 4 in February (a crummy month for many stocks) with the end of February general market melt-down and then received new life in the second week of March. Whenever your stock is down on the 21 EMA and pulls back and leaves a long tail - buy it - put your stop under the tail and have no fear. You can see this also on the CROX chart back in May and June '06 - so you wouldn't have had to waitfor the cross over. And remember - the cross over is a very conservative entry - the move has begun by then.
So for about a year or so you could have bought and sold CROX from just technical analysis with no regard to fundamentals, product roll outs or any of the other nonsense that the analysts like to jibber-jabber about. And the only two things that mattered: was anyone else buying/selling the stock which the candlesticks make abundantly clear; and, what is the overall market doing?
So is technical analysis worthwhile? Forget the global answer (remember rule 1) and just learn it and do it. What works works.
Saturday, May 19, 2007
To Each His Own
TradingMarkets is a source of a lot of trading ideas. Here's one that was published this morning in Yahoo Finance. The premise of the article is that you should wait at least 15 minutes after the opening before day trading and that is always a good idea. Now I don't think I would just willy-nilly throw money at a stock as is suggested but if after the first 15 minutes it was bouncing off the S1 or S2 I might take a shot at it - as readers of this log well know and I would probably make some good coin - which you also know.
The one thing however that these guys insist on is that you always trade stocks above the 200 MA. I say that is an interesting idea but not necessarily appropriate to the current market - in other words - bullsnot.
In a recent article (not the one cited above) they describe a 5 day down system where you bought the sixth day after 5 lower lows in a row. We looked at similar methods many years ago and in fact wrote about a couple here in this BLog last year - they don't test very high so I've sort of rejected the whole idea. But TradingMarkets goes on to say (as they always do) to only use this method when the close is above the 200 MA. I say only use it when the close is below the 200 MA. Who's right - who's wrong - two men enter Thunderdome and only one leaves ....
Unlike TradingMarkets who uses a hundred years of data to prove their contention I use only 80 days. The fact that my 80 days just happened and their hundred years happened - oh a hundred years ago must have some bearing on the results of my tests because -
I win. That's significant and case closed. The reason why stocks below the MA 200 do so well is because all stocks that are trading above their MA 200 now once traded below their MA 200. This absolutely incontrovertible fact leads me to think that somebody, somebody really, really, really smart, must have bought them below their MA 200 or they wouldn't be trading above the MA 200 today.
So it's up to you - the TradingMarkets way (above MA 200) or the really, really, really smart way (below MA 200) - your choice.
The one thing however that these guys insist on is that you always trade stocks above the 200 MA. I say that is an interesting idea but not necessarily appropriate to the current market - in other words - bullsnot.
In a recent article (not the one cited above) they describe a 5 day down system where you bought the sixth day after 5 lower lows in a row. We looked at similar methods many years ago and in fact wrote about a couple here in this BLog last year - they don't test very high so I've sort of rejected the whole idea. But TradingMarkets goes on to say (as they always do) to only use this method when the close is above the 200 MA. I say only use it when the close is below the 200 MA. Who's right - who's wrong - two men enter Thunderdome and only one leaves ....
Unlike TradingMarkets who uses a hundred years of data to prove their contention I use only 80 days. The fact that my 80 days just happened and their hundred years happened - oh a hundred years ago must have some bearing on the results of my tests because -
Greater Than MA 200 = 53% win rating, .89 reward/risk, -9.73% ROI
Less than MA 200 = 56% win rating, 1.96 reward/risk, 85.92% ROI
I win. That's significant and case closed. The reason why stocks below the MA 200 do so well is because all stocks that are trading above their MA 200 now once traded below their MA 200. This absolutely incontrovertible fact leads me to think that somebody, somebody really, really, really smart, must have bought them below their MA 200 or they wouldn't be trading above the MA 200 today.
So it's up to you - the TradingMarkets way (above MA 200) or the really, really, really smart way (below MA 200) - your choice.
Here Come The Homies
The other day we had the economic report regarding the lowest number of building permits being issued in 17 years. I said - that's the bottom - apparently a lot of hedge funds read me because -
XHB

That's the homie sector ETF and, yes that's a cross over. What I like about this cross over and I don't like about the one several days ago on 05/09 is that this one was preceded by a BOB formation too. And that is an excellent entry into the cross over.
Here's a couple of builders and guess what

And my favorite - DHI

I'm not suggesting that you run out and get some - but I'd certainly keep an eye on XHB for awhile and if you get a weekly cross you might want to get real re: real estate.
Comparing Data Streams
I don't know whether you like ratio charts like this - I don't.

That's because I'm kind of a dull boy and I can never understand them as well as I should at first glance - in other words - I have to interpret what they are trying to tell me before I understand what they are trying to tell me and in the end I'm no more informed than at the beginning. Because - truthfully - the fact that DIA:IWM is currently 1.66+ is absolutely meaningless to me regarding either DIA or IWM.
That's why I invented Marlyn's Curve. The curve represents the same concept except in more quickly understood gaudy colors.

This is the exact same 200 days and I can easily see that, first, the large cap as indicated by DIA is running away from the small cap as indicated by IWM, and second that the DIA is rolling over - which is something you don't catch on the abc:xyz charts.
Now comes performance charts and while not exactly the same as Marlyn's Curve (not as smoothed) they tell basically the same story for less work

John Murphy (stockcharts founder and guru) has hit another home run. Of course this doesn't measure the momentum (which is why I smooth the Curve) so you don't get that but if you want a quick, smart, and low work comparison - performance charts is the place to go.
Wrapping Friday
A little late but it is the weekend and no blood no foul. I didn't observe the market yesterday on my usual, up-to-the-minute basis but I can say this - it wasn't pretty. Only the small caps showed any real spirit. The roller coaster ride yesterday just yields chop chop and that will chop chop a trader's account to pieces. I find yesterday's small cap trace most interesting - is it possible that we will see a rotation out of large and mid back into small? Something to watch for.
I let JNPR go to a very generous stop and picked up two new ones off the new weekly cross over filter - CNO and KTC. CNO is an insurance company that I think will probably return back below the EMA 21 soon and KTC is the Korean telephone company - one of the top 5 Korean companies listed on the NYSE. One lost about 14 cents and the other made about 14 cents and that's how I know that the market is running on empty. If every share isn't participating there is a reason and when two profitable companies don't participate the reason isn't good.
I monitor the three stocks that I call the "three amigos" to stay abreast of technology by watching the three "must-have" stocks of the past 5 years. They are currently telling a story about a market in distress. AAPL made 58 cents, GOOG lost 64 cents and MSFT lost 15 cents. This suggests that the market is drying up and losing momentum.
This also suggests, in a more visual manner, the lack of momentum

The market, regardless of what the indices do, is made up of thousands of individual stocks and a lack of buying or selling causes momentum to dry up. Without buying or selling there is no market and generally speaking a dull market drifts down. That's because in tough times there is always a seller willing to cut his price just enough to entice a buyer.
The INDU ATR went up to 100.18 and that continues to confirm the rally. I'm disappointed that the last sub-80 event was a one day drop that flopped but we take what we can get.
The model portfolio gained 1.26 to 18.07 and the benchmark gained .87 to 8.71. The rate of change in these two components also leads to back to market health. The fact that the model portfolio ran out of gas a week ago and can't seem to get back in the game even though the benchmark is advancing nicely suggests that buyers are running out of liquidity.
The VIX remains in neutral but the up/down ratio printed 68% and I go with the up/down ratio (especially the Monday following expiry). I'm calling Monday down.
The coin is calling Monday ... heads - an up day - we'll see.
I won the contest Friday and the coin missed that makes the score Marlyn 37 - 29 and 15 and the coin is 38 - 27 and 15.
Friday, May 18, 2007
Easy Swing Trading - The ETFs
Exchange Traded Funds (ETF) are yet another way in which you can swing trade - either by trading the funds themselves or, by going into the funds and trading the components after a weekly cross over.
Here are a few of the SPDRs which are probably the best sector funds to watch -
Energy - XLE

You can pick out the cross overs for yourself - you can see - once you get the cross over in most instances it would be a good idea to start picking up some of the underlying stocks.
Here's XLF

This one had a long run after the composite cross over last July.
And finally XHB - the homebuilders

Last November there was that brief flurry of activity that lasted for several months. You can bet I'll be watching this one for the next cross over.
That will do it for now in our easy swing trading series - the point and objective is to get you thinking in different time frames in order to make better profits.
Easy Swing Trading - The Filter
I wrote a filter that will help find weekly cross overs. It is pretty simple and seems to work - at least to the point of getting candidates. After that you are pretty much on your own - the weekly filters don't back test well in stockfetcher.
show stocks where close is between 15 and 35
and average volume(90) > 500000
and weekly open < weekly ema(21)
and weekly open < weekly ema(8)
and weekly open < weekly ema(4)
and weekly close > weekly ema(21)
and weekly close > weekly ema(4)
and weekly close > weekly ema(8)
and weekly close > weekly open
and chart-display is weekly
and add column weekly atr(10)
and sort on column 5
Easy Swing Trading
The best way to select stocks for a swing trade that will last a couple of weeks is to use the weekly charts and watch for cross overs. Here is an example - NTRI

You can see that there were two on this chart - the effect lasted for several weeks each time - and you would have made a couple of dollars on each trade.
Of course you could have a farm - GIFI

With 10 events in 4 years - every couple of months it hits again. Once more some real money is possible.
And still some more examples - these are from the IBD top 10 that I talked about the other day. ARGN

July 05, Feb 06, Sep 07 and continuing. Here's AZZ

How can you not love a stock named "AZZ" - what were they thinking! - Jan 06, Jun 06, March 07. And now BTJ -

Jun 05, March 06, Aug 06 (but that one failed), Oct 06, and Jan 07.
And finally one that Dogwood picked up off a daily cross (which means a short term play), Ruby Tuesday (RT) -

A nice composite (candletrick) Oct/Nov 05, and then a clean cross in Aug 06, and another one in Jan 07.
How do you find these? Put up a weekly chart pattern in just about any package and start filling in stocks that you might want to buy. If you use a price range that will permit you to buy in bulk you will be better off and, when in doubt between several stocks pick the one with the lower ATR(10).
There, almost anyone would have paid $60 for a book containing that information (everyone else would have bought it used on Amazon for $30) - and speaking of AMZN

July 05, Nov 05, a failed one Jun 06, Sep/Oct 06, Feb 07, and Mar 07 it's a gusher!.
Thursday, May 17, 2007
Wrapping Thursday
Played golf again today and am planning to play again tomorrow. Can't shake the spring fever and sitting behind a computer screen all day is not the cure.
And then there were two - I'm down to GGB and JNPR and I will stay in this holding pattern for awhile longer. The model portfolio lost again today to 16.60 and the benchmark printed 7.77. But the IBD Top Ten actually gained a bit to finish at -1.72. Almost all of the action has been in one stock, TNH, which has both dropped 5 points and gained 5 points in the last three days. So for all practical purposes, remove that stock and it is printing -3.02. So you take out a break even stock and the top ten are busy slipping away. I won't report it for a few days now - we'll check back in next week.
The three Amigos are back to normal - AAPL is advancing, GOOG is declining, and MSFT is going sideways having lost 9 cents today. You can have your investments in all three of them - they, to put it plainly, suck.
The VIX remains in neutral, the up/down ratio is at 44% which is also neutral, and the NewMoMo is also at neutral -

The INDU ATR went up a couple of points to 97.55 which means that the rally will continue and despite the neutrality in everything else tomorrow might be an up day.
I'm looking for an up day tomorrow. The coin is looking for an ... tails - down day tomorrow.
I hit today and the coin missed that makes the score Marlyn 36 - 29 and 15 and the coin is 38 - 26 and 15.
See you tomorrow.
ATR Testing
We've covered some of this before but I like to revisit favorite themes every now and again to ensure that new readers have a chance to understand what we do here.
Today I'll discuss the advantage of using the average true range which I use as a 10-period averaged value or, ATR(10). I have reasons for using the 10-period - first it is the one most commonly defaulted on the various software packages I access but second - I've tested other lengths and the 10 always comes up the winner.
When I'm day trading from the minute charts and I have a couple of different selections I always like to use the one(s) with the highest ATR(10). However, when swing trading and trying to select between stocks I like to go with the lowest ATR(10).
The ATR is an excellent proxy for volatility and if you are looking for a quick 50 cent jump you want high volatility. On the other hand if you want a sustained rise over several days you want to start from a low volatility position.
This can be proven and I wrote a simple test to do so. I tested the 4 day to 30 day returns of stocks trading between 15 and 35 dollars with a moderate 90-day average volume of 500000 shares for each of the two following conditions -
While the low model achieved a much better return than the high model it really isn't anything to cheer about.
But I did capture this low method in the previous filter post - A New Way to Look at RSI(2) and ATR(10). And while I'm not using a 26-week low I am using a low reading that is unbounded.
Today I'll discuss the advantage of using the average true range which I use as a 10-period averaged value or, ATR(10). I have reasons for using the 10-period - first it is the one most commonly defaulted on the various software packages I access but second - I've tested other lengths and the 10 always comes up the winner.
When I'm day trading from the minute charts and I have a couple of different selections I always like to use the one(s) with the highest ATR(10). However, when swing trading and trying to select between stocks I like to go with the lowest ATR(10).
The ATR is an excellent proxy for volatility and if you are looking for a quick 50 cent jump you want high volatility. On the other hand if you want a sustained rise over several days you want to start from a low volatility position.
This can be proven and I wrote a simple test to do so. I tested the 4 day to 30 day returns of stocks trading between 15 and 35 dollars with a moderate 90-day average volume of 500000 shares for each of the two following conditions -
ATR(10) reached a new 26-week high = 49% win percentage, .63 Reward/Risk, and -62% ROI;
ATR(10) reached a new 26-week low = 62% win percentage, 1.52 R/R, and 49.74% ROI.
While the low model achieved a much better return than the high model it really isn't anything to cheer about.
But I did capture this low method in the previous filter post - A New Way to Look at RSI(2) and ATR(10). And while I'm not using a 26-week low I am using a low reading that is unbounded.
A Good Day Trade Method
I've always liked the counter trade where the stock opens and then begins dropping and then reverses. For years I played this based on tweezer bottoms, 15-minute BOB's and other indicators - many of which were good, some not so good. But the best way that I have found to play the counter trade is with pivot points.
Here is BGG as an example

At 11 A.M. BGG dropped through the S1 point (green on my display) after bouncing off of it twice before (15-minute charts). As far as I'm concerned it is a high probability point to buy off the 11 A.M. candle just as it transitions to the 11:15 candle and set your stop just below the 11 A.M. candle's low. At 12 A.M. it met resistance at the day's pivot point but based on the thrusting action ahead of this I I decided to keep it and see what happened next. This could also be considered a Return to 4 move which it turned out to be. Once more it went back through the pivot point and finally hit R1. At R1 you got a decisive move down at 14:00 and that would have been a great time to exit this trade. Actually there is no fault in exiting when the stock breaches R1 at 13:15 because the move would be exhausted by that time.
One thing that you might want to do is to examine this chart in the context of the candle's body and the EMA 4. One of the reasons that I use EMA 4 is that it seems to act as an immediate attractor for the stock price. And when the candle's body leaves contact with the EMA 4 either high or low there is almost an immediate attempt by the price to reestablish contact. Now I'm not suggesting that all of the trader's in the stock follow the EMA 4 - they don't but what I am suggesting is that stocks become locally oversold or overbought and the EMA 4 seems to monitor that condition.
The end of the day saw the stock go into an interesting situation - a pivot retest, a crossover, and a tweezer bottom coming off an RSI(2) < 2 all at once. Had this occurred earlier in the day it might have been actionable but I never carry over 15-minute charts from one day to the next.
Wednesday, May 16, 2007
A New Way to Look at RSI(2) and ATR(10)
This was the lead paragraph of today’s economic blockbuster - Home building posted a small gain in April, but permits for future construction plunged by the largest amount in 17 years, a sign the nation's housing industry is still in a deep slump.
When is the best time to buy something? I’ll give you a hint “buy low - sell high.” That’s right – when it is hitting record lows and it is something that you are pretty sure will recover, eventually.
Today’s filter is a new one and once again is a very simple one –
You really can’t get much simpler than that can you?
It tests very nice too both in the short term (4 day swing) and in the mid term (30 day trades).
Short term – 69% win rate, 2.30 reward/risk ratio and a 95% ROI that’s compared to an SPX ROI of 1.54% for the same period. In other words, the market was depressed when this filter was tested.
The net change over 20 and 30 days was 3.56 and 3.63 respectively so this filter has some legs as they say.
The interesting thing about this filter is that as I go back through the previous day’s selections it shows a significant number of wins. Sometimes it takes a couple of days, sometimes a few weeks, but eventually the stocks selected seem to turn up. The best selections however are those that have the highest volume and that are beginning to ascend on the day after the filter finds them.
Here are a couple of examples.

and this one

Now why do you think that this filter is so appropriate to today’s blockbuster? Because this report means that the crisis is nearly over and any small increase in housing permits next month will make the housing stocks go boom. Bank on it.
When is the best time to buy something? I’ll give you a hint “buy low - sell high.” That’s right – when it is hitting record lows and it is something that you are pretty sure will recover, eventually.
Today’s filter is a new one and once again is a very simple one –
show stocks where close is between 15 and 35
and average volume(90) > 500000
and rsi(2) reached a new 4 week low
and atr(10) reached a new 4 week low
You really can’t get much simpler than that can you?
It tests very nice too both in the short term (4 day swing) and in the mid term (30 day trades).
Short term – 69% win rate, 2.30 reward/risk ratio and a 95% ROI that’s compared to an SPX ROI of 1.54% for the same period. In other words, the market was depressed when this filter was tested.
The net change over 20 and 30 days was 3.56 and 3.63 respectively so this filter has some legs as they say.
The interesting thing about this filter is that as I go back through the previous day’s selections it shows a significant number of wins. Sometimes it takes a couple of days, sometimes a few weeks, but eventually the stocks selected seem to turn up. The best selections however are those that have the highest volume and that are beginning to ascend on the day after the filter finds them.
Here are a couple of examples.

and this one

Now why do you think that this filter is so appropriate to today’s blockbuster? Because this report means that the crisis is nearly over and any small increase in housing permits next month will make the housing stocks go boom. Bank on it.
Wednesday Wraps
I think I'll just burn it from now on - absolutely nothing takes - I get on board and it goes up 20 cents and then bang - crash - smash - gone to hell. It's part of the general malaise of the season - that and hay fever run amok. Fortunately my burn rate is small and I'm making more than I'm losing. Blessed steel - it made Andrew Carnegie and now it is making me.
The headline excuse for this morning's drop is the "mixed housing data" which longtime readers of this site know I would consider to be absolute bullsnot of the finest kind. Bullsnot because this isn't news - it is expected - it is known - and if it didn't affect the markets yesterday it shouldn't affect them today. But it does because the moron money managers out there live in fear. I think most of those guys, no - all of those guys and most of the women bring a change of undies to work every day because every day at least one or more expected news stories will get them crapping their pants. Dumbasses - one and all. It must be awful to go through life being compared to a mindless index which is affected by everything you and every one of your dumbass peers does.
Well there, I got that off my chest and I sure feel better. I think the world would be better off if the stock market only operated on Tuesdays and Thursdays and the rest of the time was devoted to meditation and self-evaluation. Anyway we did make some money today and I think everyone did so I guess once the money managers changed their dainties they came to the rational conclusion that nothing had changed. Morons.
I'm holding GGB, a very small portion of BGG (only because it hasn't hit the stop yet) and a moderate portion of JNPR. Everything else is gone, gone with the wind, gone with the rain, gone to hell. Doesn't matter - I plan to double up on GGB and start looking for some other commodities to buy (not gold or silver).
AAPL actually lost some today and I'm trying to figure out what that has to do with new construction permits but I can't. GOOG made a bunch today and I suppose that's because everyone is doing a search on "housing permits" and MSFT, good old MSFT rewarded its loyal followers with another 17 cents - coin of the realm - better than gold (at least I can take it down to the gas station and add another lot of money to it and get a gallon of gas - let's see you do that with a gold bar).
The model portfolio is starting to mature - it only went up .68 today to 17.66 and the benchmark also went up .68 to 7.98. The IBD Top Ten went up .86 to -2.43. I wonder if today's top ten did any better.
The VIX is back in neutral the up/down ratio printed 58% so that means a moderate to down day tomorrow and the INDU ATR is at 95.74 which means the rally can continue.
This guy pulled into the neutral zone too

The coin is calling for a ... heads - up day - what do you know - the coin disagrees with me. Based on its record vs mine - I'd go with the coin.
We both hit it today so the score stands at Marlyn 35 - 29 and 15 and the coin is 38 - 25 and 15.
I've got a whole bunch of new posts planned including a new way of looking at the RSI and ATR. Stay tuned and if I can find the energy I'll get them out.
Summertime and the Living is Easy
I have the worst case of spring fever ever known to man both physically in all of its manifestations and mentally and spiritually. Consequently it is taking just about every ounce of effort I can muster to post anything - even though I love it so.
That said here is an education in a chart. Listen and learn.

As normal I haven't a clue what this company does or how well they do it - all I see is blips on a screen. Here is what the blips from the past told me - on 3/07 a BOB completed. The blowoff in this instance was so obvious that only a moron could have missed it. Then the traders in this stock kind of swapped shares back and forth for awhile (and yes after the fact we can call that a "base" because it is so obvious) but more important it never went below the low of the second BOB bar. It took about 8 days to break out of the "base" and once that breakout occurred it was full steam ahead for a few weeks.
On 4/24 you got the kiss of death - the "cathedral of dead money" - a gap up away from the EMA 4 that it had been riding and a failure to advance. Sell, Sell, Sell, Sell as my BFF Jimmy Crack Corn Pone would scream. And don't buy back until it breaks 30.60 decisively (that was me - not Jimmy). It didn't. Instead it hit a slide and now look at it. Once more "consolidating" or "basing" or whatever you want to call it (I prefer "not trending" because that is descriptive and actually means something) and there is a good possibility that it is poising for another upward move. Especially since it printed another BOB on 5/14.
I say you could buy it now with a stop just below 25.20 or wait for it to break above 26.10 and take a shot there. Either way it is an impressive chart and might even return a couple of bucks before its next alarming drop.
Of course if it breaks below 25.20 you may want to ignore it and go on to something else.
Tuesday, May 15, 2007
Wrapping Tuesday
I went out to play golf - much better use of my time - of course my holdings all went to hell as a result. But that's the price you pay. If we don't get some recovery tomorrow I might be completely in cash by this time tomorrow evening.
I detailed all my trades this morning so I won't recap them here. I'll just go to the numbers.
The INDU ATR went up to 95.80 today which permits the rally to continue. The model portfolio lost .61 today to 16.86 while the benchmark gained .03 to 7.25. Of course the IBD Top 10 went down 3.27% most of that due to a major loss in TNH. We'll keep track of it.
Both AAPL and GOOG lost money today but the owners of MSFT are singing - "We're in the money" based on that massive 3 cent gain today.
The NewMoMo slipped down a bit more which is good

and the VIX is actually 5% over its 10-period MA. The up/down ratio is printing 35% which is also good.
I'm calling for another up day tomorrow and I hope it isn't another tie day like today.
Coin says ... heads - also an up day.
Another tie so the score stands at Marlyn 34 - 29 and 15 and the coin is 37 - 25 and 15. All of this market chaos has got to come to an end sooner or later - I find it interesting that the broad market (SPX) and the NASDAQ (COMPQ) are both losing while the INDU gains new records. Doesn't make sense.
See you tomorrow with more astonishing information and data.
Tuesday Morning
Can't fool the market - at least not the NASDAQ - watch them tech shares go down. The other thing that was going down was BGG and I should have sold it out two days ago on the hanging man on 5/11 but I didn't. Arrogant fool that I am I believed - so much for believing. I sold most of it and am keeping a handful of shares just in case it might resume the march. I still don't trust this market and I think that that we need a 4 or 5 day correction.
I added to USU on a 15-minute bar cross over at the open and I added onto AV on an S1 hit and bounce on the open. Both those trades appear to be working out.
ANO continues to do nothing and GGB is now my only steel stock and so I'm going to hang on to it for a bit. I think it is getting ready to breakout.
Other than that I think I'm done for the day so I'll see you tonight at the Wrap.
Update - I just can't get enough of it - sold off ANO because it isn't participating (have I ever mentioned that I hate cheap stocks?) for an $86 loss and bought JNPR in its place. JNPR is one of the stocks from my must buy list ("must" in the sense of when you need a quick lift). I'm planning on dumping out of AV too - but I need another 2 cents to cover the round trip commissions. I'm fairly certain I'm not going to get it today.
Update 2 - I dumped out of AV for a $40 loss - didn't get the 2 cents and in fact lost another 2 cents - decided to let it go before it got the best of me. I just couldn't believe.
The Double Cross
Last week I posted this chart and I said at that time it didn't look like it was a good thing -

Apparently it isn't
I think I'll wait for the next cross over.


Apparently it isn't
I think I'll wait for the next cross over.

Tuesday Morning - CPI Day - HooRay! HooRay!
I don't know what to say about this - it hit the expected target but the "12-month rate is lowest in a year" - that's good news and good news and the FOREX market said -

Which is about a benign as you can get in the face of the CPI announcement. The NASDAQ market began pulling up instantly and the futures fair value indicator went green.
We might have a good day after all.

Which is about a benign as you can get in the face of the CPI announcement. The NASDAQ market began pulling up instantly and the futures fair value indicator went green.
We might have a good day after all.
IBD Top 10 Part II
Bullish Jim put a good comment on the first post in this series and it is worth your effort to take a look. And now. as Paul Harvey says, for the rest of the news.
I went through the 10 charts and made an astounding discovery - every one of these signaled its current break out via a crossover of one kind or another. Most were clearcut, a couple were the "candletrick" kind that I wrote about previously.
Check out ARGN - it had two -

One on 3/29, and another really good one on 4/19.
The list goes like this -
So there really wasn't any reason why we couldn't have found these stocks on our own without the IBD subscription. Of course you will only read about cross overs here at Marlyn's place.
I went through the 10 charts and made an astounding discovery - every one of these signaled its current break out via a crossover of one kind or another. Most were clearcut, a couple were the "candletrick" kind that I wrote about previously.
Check out ARGN - it had two -

One on 3/29, and another really good one on 4/19.
The list goes like this -
AZZ - 3/26
BTJ - 3/06
BWLD - 1/2 and again 2/29
CYNO - 3/07
GSOL - 4/02 + 4/03 (combined candletrick)
MTOX - 2/27
EDU - 3/14, and again 4/3 and 4/4 and 4/5 (in case you didn't get the message)
SYNL - 3/7 + 3/8 (candletrick) and again 3/15
TNH - 3/5 + 3/6 (candletrick)
So there really wasn't any reason why we couldn't have found these stocks on our own without the IBD subscription. Of course you will only read about cross overs here at Marlyn's place.
IBD Top 10
Wandering around the YHOO financial site yesterday evening and I came across an article regarding the IBD Top 10 stocks. I'm always interested in such things and so I took a look and found these ten stocks listed.
Now it is possible that I missed the memo because I don't normally read the IBD propaganda but looking at the charts for each of these stocks led me to two thoughts - thought 1 - well. yes, they do deserve to be on a top 10 list, and, thought 2 - when were they put on the list?
For example let's take ARGN. Was it put on the top 10 list yesterday or on 4/30 which would have been in front of the current move or on 2/20 which would have caught a super move?

And how about BWLD - same questions - same dates -

Needless to say these are hot stocks but will they remain so? My thinking is if this is the first time they've been exposed to the public then there should be a bit of a rush to get on board even at this late date. You know how sheep-like the general retail crowd is - ring a bell and they'll follow anything - including the wolf.
Anyway - I put these 10 stocks in a portfolio and will check back every day for the next week or so and we'll see how well the "IBD Top 10 of 5/15" is doing. It is possible that this is a good screen for a quick in and out swing trade - you never know.
ARGN
AZZ
BTJ
BWLD
CYNO
EDU
GSOL
MTOX
SYNL
TNH
Now it is possible that I missed the memo because I don't normally read the IBD propaganda but looking at the charts for each of these stocks led me to two thoughts - thought 1 - well. yes, they do deserve to be on a top 10 list, and, thought 2 - when were they put on the list?
For example let's take ARGN. Was it put on the top 10 list yesterday or on 4/30 which would have been in front of the current move or on 2/20 which would have caught a super move?

And how about BWLD - same questions - same dates -

Needless to say these are hot stocks but will they remain so? My thinking is if this is the first time they've been exposed to the public then there should be a bit of a rush to get on board even at this late date. You know how sheep-like the general retail crowd is - ring a bell and they'll follow anything - including the wolf.
Anyway - I put these 10 stocks in a portfolio and will check back every day for the next week or so and we'll see how well the "IBD Top 10 of 5/15" is doing. It is possible that this is a good screen for a quick in and out swing trade - you never know.
Monday, May 14, 2007
Wrapping Monday
What a boring day. The market is waiting for the CPI data - the market already knows that there will be inflation in it so why it is waiting I don't know but that's the headline story so it's what we'll go with. Maybe there will be a CPI surprise but I doubt it - I smell inflation in the air. But if it comes in .0001% less than the expected then watch out above. To business -
I bought and sold and re-bought USU today. Once this morning and once this afternoon. I sold of AKS and I'm done with it. I'll wait for the next major pullback - I think that stock is finished. I bought (only once) ANO and even though it lost 6 cents on me I'll hold it for awhile. I managed to round out GGB to a full position and now I'm done with that one. If it doesn't continue to rise I'll sell it just as quickly as I bought it back.
There isn't much in the market any more that looks very appealing. I'm still holding BGG and AV and the latter went up today and the former didn't.
At one time today the VIX was actually more than 10% over its 10 day MA and now it is back to neutral.
The model portfolio lost 1.88 to 17.63 and the benchmark lost .21 to 7.24. The benchmark is doing a lot better in a down market than the model. That is to be expected because the model has a lot of high beta stocks in it and they will gain quickly and lose quickly too. It is not a balanced portfolio only a growth portfolio.
AAPL continues the march forward, GOOG continues the retreat, and MSFT continues to go sideways.
The INDU ATR printed 91.23 and that means that the rally will continue (after a small pause).
This guy went down some more -

and that is goodness because what it is showing is a coiling action in preparation of an explosive move up. Well I think so, anyway.
The up/down ratio printed 33% which is in the oversold territory.
As always I'll go with the up/down ratio and call tomorrow an up day.
The coin follows my lead although I don't know why and also calls for an up day.
This was one more split day - they are becoming routine and that has to mean something although what I don't know. Anyway the score stands at Marlyn 34 - 29 and 14 and the coin is 37 - 25 and 14.
See you tomorrow.
Looking At A Couple Of New Stocks
I've got two on the radar this morning. Both are from the Industrial Metals and Minerals group as found on the Leading and Laggard site from Yahoo Finance.
The first of these is USU which has a nice pivot point profile -

and the second is ANO which is a real cheapie but also with a nice profile -

And I intend to take a position in both of these today.
The first of these is USU which has a nice pivot point profile -

and the second is ANO which is a real cheapie but also with a nice profile -

And I intend to take a position in both of these today.
Subscribe to:
Posts (Atom)
