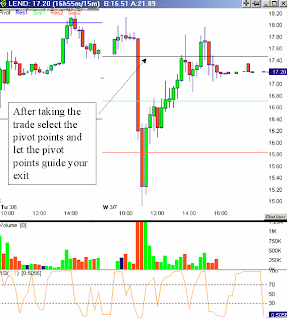
Here's what you do. Put up about 10 charts and it doesn't matter what they are or what companies they are just 15-minute charts of companies that you would trade. The charts should have nothing on them except candlesticks, no moving averages or other wingdings. In the lower windows ensure you can see volume and the RSI(2) plot. Then watch the charts. What are you watching for? - an Enhanced BOB. If you see this take the trade - the Enhanced BOB is -
A 3-bar set-up
Bar 1 - Red bar
Bar 2 - Red bar with a lower low than the previous bar and higher volume than the previous bar
Bar 3 - Green bar with a higher low than the previous bar
AND (mandatory)
- the RSI(2) is less than 5 and it is associated with 1 of the 3 bars in the set-up.
Put your stop below the low of the 2nd bar.
If you see these things you take the trade. And if you don't see these things? Don't take a trade.

After you take the trade add pivot points to the chart and let the pivot points dictate your exit (or end of day)

But what if I sit here all day and I never see a trade develop? Oh well - there's always tomorrow.
That's it - one set-up, one time scale, one exit objective. No distractions.
Update - Remember a BOB being used on minute-based charts is confined to a single day - I've never run it across day boundaries.

9 comments:
Nice post Marlyn.
I have a new trading idea for you.
I'll continue to day trade and lose money, then I'll let you know what I did, you write your usual informative posts but charge your readers for your info, then split the proceeds with me, well, at least enough to cover my commissions and losses.
What do you think!? :) LOL!
Yes, I woke up with a better perspective on life and trading than I had yesterday. Can ya tell!
Good luck today!
I wrote this one with you in mind - sometimes the distractions eat you up. Keep it simple amigo - real simple.
Are you sure if you wait till tomor that you'll get a trade with ten charts. This setup looks pretty specific and it seems to me if you have ten charts you might wait a many days for a trigger. I need action!
Yeah - that's not the point of the post - the number of charts don't matter just getting a few winners is all that matters.
If you want to put up 100 charts or a 1000 that's up to you - as I say often - your money - your play.
I should have read this post before I traded, er, got chopped-up today. Never, ever, chase price and wait for confirmation (candle close) before entering. I broke those rules twice today and it felt like someone was feeding me tomatoes with a slingshot. Ouch! I did see a lot of BOB's today (after the losses). Thanks for the additional info on using the RSI(2) for the set-up.
Have a pleasant evening.
Philip
So, the first chart I look at with my newfound BOB info is TSL on 3-1-07. BOB formed during the first 3 bars with the accompanying RSI(2)< 5. The move produced over a one dollar gain. Amazing. Marlyn, you're a genius! The complexity of your set-ups astounds me.
Grazzi, again.
Philip
Sorry for over-posting, but I'm having fun with my new toy. Did you see JSDA today? All the ingredients blended together perfectly at noon---move good for $.20-.25. Wish I woulda been paying attention after hours!
Philip
Hi Marlyn,
Interesting pattern that you have described here. One possible issue I see is this: You'll never know the low of the green bar until after it is printed, so the earliest you can get in is the close of that green bar. Is that what you suggest as the entry point for the enhanced BOB trade?
Theirs always trouble somwhere.
Post a Comment