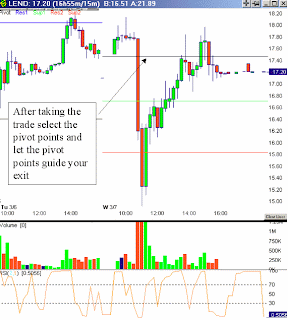
Here's what you do. Put up about 10 charts and it doesn't matter what they are or what companies they are just 15-minute charts of companies that you would trade. The charts should have nothing on them except candlesticks, no moving averages or other wingdings. In the lower windows ensure you can see volume and the RSI(2) plot. Then watch the charts. What are you watching for? - an Enhanced BOB. If you see this take the trade - the Enhanced BOB is -
A 3-bar set-up
Bar 1 - Red bar
Bar 2 - Red bar with a lower low than the previous bar and higher volume than the previous bar
Bar 3 - Green bar with a higher low than the previous bar
AND (mandatory)
- the RSI(2) is less than 5 and it is associated with 1 of the 3 bars in the set-up.
Put your stop below the low of the 2nd bar.
If you see these things you take the trade. And if you don't see these things? Don't take a trade.

After you take the trade add pivot points to the chart and let the pivot points dictate your exit (or end of day)

But what if I sit here all day and I never see a trade develop? Oh well - there's always tomorrow.
That's it - one set-up, one time scale, one exit objective. No distractions.
Update - Remember a BOB being used on minute-based charts is confined to a single day - I've never run it across day boundaries.
