Sunday, October 22, 2006

SMH vs SWH

The SMH is the semi-conductor holders ETF and the SWH is the software holders ETF. These two ETFs more or less track with one another or have since their inception back in 2000. Right now there is a huge disparity between these two and some folks are suggesting that you short the SWH and go long the SMH until they revert to mean. I read about this in one of the BLOGs I follow, the shark report, where David explains the entire situation very clearly. Just click on the link to the right and you can go see what he has to say. But, true to my nature, I needed a better picture and here is what I came up with -


What I did was download the historical daily closes for the two ETFs, add them together, divide by 2, then divide each one by the result of the third step and plot the final product and what you see is the SWH running way above the SMH. You also see that in the past these two have stayed pretty close to one another. This diversion began about 100 trading days ago or earlier in the summer or about the time of the last earnings reports.

The idea now is that the black line will close up towards the red line and vice versa. Now needless to say but say it I will - that doesn't have to happen - in other words software can continue for a long time above hardware and in fact never come back to meet with it - this probably won't happen but it is possible.

All I wanted to do was show you a different way of looking at the situation since I've never been able to understand those xyz:abc charts. And this, I think, shows the situation in a much better light.

Process Trading

Note I didn’t title this “the process of trading” which would be a completely different beast. Process trading is what most of us do except we haven’t named it as such. These are not rules – rules are things like “don’t trade when you are sick” or “let your profits run”. A process is different in that it ensures that every trade you take is taken in the same manner for the same reason with the same expectation of results. A process contains three parts – the sequence of steps which ensures everything remains orderly, the “rules” or the “what” of the process, and the “method” or the “how” of the process. Most people just write down a set of rules or “whats” without taking into consideration the how and the when. The method is probably far more important than the rules because it is the method that ensures consistent results.

Here is an example

Gap-Down Process for Longs

When

What

How

1

At 10 A.M. Collect target stocks.

1. Using (my collection method) collect a list of candidate gap-downs (my criteria for candidates)

2. Transcribe the list to (my charting software) watch list

2

Set-up watch list charts for initial observation

In (my charting software) set

  1. n-minute frequency
  2. Candlesticks
  3. Volume enabled
  4. other as required

3

Every n minutes thereafter until 11:00 check watch list for trading targets

A dummy spot was formed in the last n-minute increment

-OR-

The last n-minute increment low is higher than previous 2 or more declining lows

-OR-

The last n-minute increment formed a white hammer-like formation that follows 2 or more declining lows

4

Given any one of the several targeting criteria in sequence step 3 - Wait one n-minute increment for confirmation

Did a white candle form following the targeting criteria?

5

If yes - purchase stock

Open a session with (my brokerage account) and follow (my trading process)


The trading process includes algorithms for numbers of shares to be bought, where stops are to be set, and a method for exiting the trade if not stopped out.

Now if you identify all of your trading set-ups long and short in this manner you will be a far more successful trader in the end.

Saturday, October 21, 2006

Friday Wrap-Up - Late Edition

Ok - there was no early edition - sue me - I'm sure you'll be able to find some well- respected Republican judge (on the take) who will agree that you have been grieviously faulted.

I made some money on Friday - I played RHAT and CTXS both off a gap down dummy spot entry point. Didn't hold either trade very long but that is the nature of such trades - if the market is booming up they go for a long time - if not they are short time make some bucks and out types. Don't matter - both can be satisfying (wink wink). Anyway for those of you who have forgotten - this is a dummy spot trade:


See the third candle - that is a "dummy spot" AKA "doji". The entry is at the high of the doji. My exit was the "tweezer top" shown in the 7 and 8th bars but the dummy spot in the 9th would have gotten most folks out anyway. A "tweezer top" is one where two candles in a row have the same high and the first candle is white and the second is red. The "tweezer bottom" is the same but at the lows and the second candle is the white one.

For Monday we could be looking at another mixed day. The up/down ratio is just about into buying territory at 40% (less than 40 is buying territory) and the new 20 day highs have backed way off to 578 - the closest they have been to 500 in 2 weeks and the new 20 day lows hit 241 which is the highest it has been in the same time but the VIX is now more than 5% below its 10 day average.

Now the VIX is tricky - it really doesn't matter much until it is at least 10% above or below its 10 day moving average and it matters more at the top than the bottom - so while it is a warning it is weak at the same time and could pull back into neutral with no adverse affect.

On the other hand the DIA finished in the red and the SPY and the Q's went white in the last hour which generally, used to mean a good day the next day because traders where squaring their positons in a positive manner.

Now I don't know what all this means but it could be that the markets are going to go down next week to end October the way they should have begun it. Also it is the week following options expiration and that is generally a quiet time.

Earnings are good for those of us who day trade the long side because they make for volatility in the market. They are especially good because when they come in bad there is no place for the stock to go but down and sometimes when they come in too good the stock also has to go down. Since there is no science to this - i.e. no one knows where the bottom is most often down is a lot further than it should be so you can pick up some real good winners riding them back up. That's what is going on in CTXS and that is as close to a stock tip I will ever give.

The magic coin or Mr. Majestic as I'm starting to call him is 21 and 10 because although the INDU was down the "market" is actually the SPX and it was up. For Monday - heads - bull again - we'll see.

Friday, October 20, 2006

Thursday is a Wrap Day

Took a position in SMH and INTC right off the bat this morning because of the dummy spot formed in the last increment on the 2-hour charts on SMH. Both went up some and I cashed when the momentum was drained. Took a position in ATYT because it looked like it was reversing - which is a dumbass reason and lost about half of what I made on my early scalps. Then I took a position on RHAT at about 11:50 off a hammer at 11:45 on the 15 minute charts - got out a few minutes later on a break even as it broke down. The bottom line is that I made a few dollars on a market that really isn't offering much. I hate those scalping trades and would have been perfectly happy if they had run which I didn't expect since the entire world is so oversold.

The up/down ratio is 54% not really out of the neutral zone yet and the new 20 day highs keep moving up way into critical territory now - 995 as the new 20 day lows languish at the bottom printing 155. The VIX remains irrelevant to anything but the three sisters all printed white candles in the final hour of trading. A good sign but this is a weak market that needs to go down before it can resume a healthy climb.

Mr. Magic Coin is 20 and 10 having gamed today correctly and for tomorrow --- heads bull market again.

Wednesday, October 18, 2006

Wednesday Wrap Up

I was wrong and the dip buyers stayed home today. I didn't do much either - left early this morning to play golf and didn't get back until just before the market closed. After seeing the action on the day I was pretty glad I wasn't here. Now that the stupid Dow has made its all time 12000 record maybe we can get the draw back we so desperately need for good market health.

The up/down ratio sits at 43% and new 20 day highs are still above 500 at 698 with the new 20 day lows at 148. Still not much to buy but the VIX is in neutral teritory and the three sisters all finished in the white. Earnings keep coming in well but earnings really don't matter when the market is so oversold. There are a lot of unatractive stocks out there right now. I think we should go down tomorrow despite earnings.

The magic coin only got one out of three right today among the sisters but I'm going to say it was wrong anyway so it sits at 19 and 10 which is still not too bad and for tomorrow it says --- heads - the bull is back.

The Joker's Wild and the Joke's On You

Earnings season is upon us so junkvision can stop using inflation as their reasoning for the market going down and they can now use earnings. Note how a market drop of less than 1% is a one day story that is blamed on increased inflation yet inflation continues every day and the market drop is a one day story - that doesn't make sense. If inflation is the cause and inflation continues then the market should continue to go down every day until mean old inflation is brought under control. Right? Obviously not - but I'm no economist I don't even play one on TV.

Anyway those of you who follow along here (thanks Mom) know that the real reason the market behaves as it does is because the magic coin is directing it ... actually you know that when there is nothing to buy people sell things and then, having sold, they look around and say "oh - look at all the wonderful things to buy" and then buy them.

This is like two neighbors, you and me say, each having a yard sale and we buy each others junk every week or so and cart it into our houses. We both feel good about selling off the old stuff and getting some new stuff but stuff is stuff - if you get my drift. Then, just like in a yard sale, every once in awhile a new buyer rides through the neighborhood and throws a potful of new money into the mix and the cost of junk goes up.

So remember it isn't inflation, or earnings, or anything else anyone else says - it is the availability of junk to be bought at a price that someone else will pay that makes the market go up. And when no one will pay the price the price comes down until someone does pay and that's what makes the market go down.

And if you don't believe me - well go back to the magic coin it makes as much sense as using something inmeasurable but continuous such as inflation or one number out of a sea of numbers that are constantly changing such as earnings.

Tuesday, October 17, 2006

Rainy Days and Tuesdays Always Get Me Down

Rained today and not only outside but also in my account. I said this morning how I should trade, I described it clearly and then proceeded to not trade that way. This is a dummy spot -


Does anyone see anything that even partially looks like that in this???


No? Are you sure? Ferris? Ferris? No? Me neither - so guess which one I bought and if you guess NVLS you are just being a smartass. I did the bad thing three times - not being satisfied with just one - fortunately I managed to escape with only minimal damage but damage all the same.

I guessed right today as far as market direction - down - but that was easy. Tomorrow is shaping up as a buy the dip day - the up/down ratio is 32% and the new highs pulled way back to 665 and the new lows increased to 140. The VIX is back in the neutral zone and the only fly in the ointment is that the three sisters all finished the last hour in the red.

I still think it is buy the dip and up up and away.

The magic coin is 19 and 9 having called today correctly and for tomorrow --- tails - bear market again.

Previewing Tuesday

According to the overnights the futures, the Asians and the Europeans, today is going to be a down day. What this means to me is that there will be a ton of gap downs to choose from and one or two of those will turn and start going up. The best method in this case will be either a two white angel (i.e. the first 30 minutes is up and thus the first two 15 minute candles are both white with a hammer-like appearance) or a three down with a dummy spot. This is a formation that prints 3 red 15 minute candles each one becoming a bit smaller in body length followed by a doji with increasing volume.

In the two white angel format I take the open of the third 15 minute bar. In the three down with a dummy spot I take the next price that exceeds the high of the doji.

We'll see how all of this turns out later but that is what I am looking for in a down market.

Monday, October 16, 2006

Monday Boring Monday

Talk about watching paint dry. That's the problem with the market these days - it is boring. We need a break in the monotony that can only be achieved by a break in the momentum such as it is.

I think that is coming. The up/down ratio is .59 creeping towards a breaking point, the VIX is 8% below its 10 day MA, 1668 stocks achieved 20 day new highs and 107 hit 20 day new lows. All the sisters finished the last hour in the red. And it wasn't some wishy washy pink but a deep red. All of this put together suggests that tomorrow could be a down day.

The magic coin is 18 and 9 having misread the tea leaves again today. For tomorrow ... tails - bear. We'll see.

Earlier I posted regarding gold and oil - for the record both went up today. I think they will continue to do so for awhile.

What a Boring Day

This has been an awful day - even though I made some money I'm about ready to fall asleep at the switch. I'm posting now just to stay interested.

I took a position in ATHR - a gap up (for a change) that did one of my favorite moves - retreated to 8. That looks like this -


You see the 4th bar hits the 8 EMA (the green line) and takes off from there - I use "takes off" in a literal sense because it went pretty much no where. I'm out just before 2 P.M. for a 25 cent gain.

Oil and Water

Actually oil and gold - Oil has been called "black gold" but I bet the people who started calling it that never realized how they would some day track together price-wise as they do now.

Here is oil and gold from a price standpoint (using the GLD and XLE ETFs as proxy)over the same time frame. Oil is displayed on the black line and gold on the (what else) gold line.


And here is a picture of the same price wise action using marlyn's curve. The same colors are used in this picture.


Aside from noting that they seem to move together you will also note that they are rising at this time. Also note that gold trails oil in price moves. So maybe you can use oil pricing as a signal to buy or sell gold. I don't know but that's the way it looks to me.

Pre Market Data

I like watching the money.cnn.com premarket trading screen in the morning just to get an idea of what the world is doing. Generally the markets open in Asia then proceed around the world in a West to East direction and by the time we open on the East coast the rest of the world is either closed or mostly through their day. I find that the Japanese generally follow the US market - in other words what we see in the Nikkei 225 is what we saw in the SPX the day before. I also believe that we follow the Europe lead more than we care to say in that more often than not if the FTSE 100 (London Bourse) is green we will have a green day too.

This morning OPEC is getting together to discuss oil production cuts - like that is going to happen - the only thing these guys can ever agree to do and succeed at is to disagree. If they do set quotas it is with the understanding that a lot of cheating will go on and absolutely no quota will ever be honored. I say that because you only ever hear of them getting together to cut production, never to increase it, yet it always increases.

Anyway that is the warning signal of the day but it doesn't seem to be affecting either the Asians or the European markets which are all in the green and strong and the futures which were in the red when I first looked at Oh-dark-thirty are now also green. Maybe the rest of the world has figured out what I figured out - OPEC production cut talks are full of something dark, stinky, and gooey and not oil.

The other thing I like to watch is the pre-market at the NASDAQ site. I don't trade pre-market - too much work - but I do like to watch it and I also like to check stocks that are on my hot list to see if they are catching a bid in the early morning light. Generally if they are I will then watch them more closely during the opening to see if I'm going to put on a trade or not. Some of the stocks I always look for are AMR, YHOO, and INTC. These are always good for a half a buck or better if there is some early interest.

The More I Trade

The more I trade the smarter I get - it only makes sense - practice makes perfect or at least adequate - perfection is not something I believe that I will ever achieve - but I won't stop trying.

My problem as I find out from reading many other blogs is the same as most people - laziness coupled with an intense dislike for hard work - well that's not exactly true - I don't mind hard work as long as it is either interesting or profitable and preferably both. This past summer I grew tomatoes and cucumbers and peppers in a little garden I hacked out in my back yard. I had never grown any of these things before in my life although my father used to so I knew it was possible. I made a huge number of mistakes but I still harvested a ton of all the above and it was all tasty and nutritious. Next year I will remember my mistakes and I will be harvesting even more tasty and nutritious vegetables from my little garden. The best part of course was that I had so much I got to share it with my golfing mates and that was grand. Everybody will take home grown tomatoes for free.

Now the laziness part is easy - had I bothered to study the problem first before starting my little garden I probably wouldn't have made half as many mistakes - but true to my nature I just jumped right in - bought some sets, threw them in the ground applied water and waited for payday. On the other hand had I not been lazy and had I studied the reams of documentation available I would probably have not had a garden in the first place because I would have learned how freaking difficult it was to do. It wasn't - but the documentation makes it seem that way.

Same thing with trading stocks for a living.

One thing I seldom talk about on this site is risk - other sites are laden with "risk this" "risk that" "I made xR on the trade" - but you won't find much talk like that here. Most of the time I don't bother with stops because I had them in the past like a good doobie and a couple of stocks dropped right through the mothers and kept on going South - they don't tell you about that in the books - what they say is - oh, you should have had "market stops" - well that is a bunch of crap too because most stocks after a steep and rapid decline actually rebound a bit and guess what - a market stop dumps you out at the very bottom and you don't get any of that rebound back. So I use mostly mental stops and if I have to go away from my monitor for very long I set a hard stop and hope for the best. Point being they only protect you from the known and you should only fear the unknown - I hope you get the idea.

I think it is up to everyone to determine their own appetite for risk and that can't be taught like a good set-up. It can only be suggested and then only mildly. I still think you should go into a trade with two targets in mind - how much you want to make and how much you can stand to lose and then you should adhere to those two targets as if they meant something.

Saturday, October 14, 2006

Friday Wraps The Cake

Me and Mr. Magic Coin were both wrong, again - once more kids - nobody knows nothing - even when the case sounds all scientific as can be and proof if profered out the bazoo - or wazoo - I never get that right either. No matter - no one is betting the farm on these pronouncements including me.

I took a small, just for fun trade in GLW off a narrow range bar on GLW (what some call a "dummy spot"). I like this trade in that it usually signifies a win - it just took a long time to develop. I sold it just before 3 (at the "dummy spot" that formed there - dummy me)and gave up a goodly portion of the day's gains - oh well - at least I made a buck on a just for the fun of it trade. In fact I covered my loss from yesterday so I was pretty satisfied with that - not.


God knows what next week brings and she isn't telling. But this is now begining the second half of October and, guess what, the market is traditionally supposed to heat up. I think it probably will for one reason only - the new 20 day highs have been booming with this latest record setting activity and while the Dow might be running out of steam the rest of the market (the other 7000+ stocks) doesn't seem to be.

The up/down ratio is only 51% which is neutral, the new 20 day highs drew back to 1397 and the new 20 day lows increased all the way to 137. In actuality that ain't much of a change on either side. The three sisters were all strong white on the last hour and that is not necessarily a great sign but it is good. The VIX just meandered more than 5% below its 10 day so we might get a bit of a correction early next week but it might not happen either.

The magic coin now holds an 18 and 8 record and for Monday it says ... tails - bear - well keep calling the same thing every day and one of these days you will be correct.

I'll be back later I want to talk a bit about day trading vs buy and hold.

Thursday, October 12, 2006

Thursday Wrapping It Up

I lost money today - $127.00. How did I do that? I played a stock without waiting for a set up. I played YHOO off a hunch and my hunch was wrong - it might be right someday but today it was wrong. Other than that I went and played golf.

Tomorrow should be a day of rest - this market has got to be tired. The up/down ratio is 68% and the new highs vs new lows is running 1525 to 117 an incredible spread. The VIX is 5% below its 10 day moving average which is always troublesome. Two of the three sisters finished the day in the red. So I think it will take a rest tomorrow and I will too.

The magic coin called out the bear and was wrong so now it sits at 18 and 7 and for tomorrow it says ... tails - bear is coming.

Wednesday, October 11, 2006

Wednesday Wednesday Wednesday - Wrap

Well I'm feeling good - even on a down day we can find some cherry's and I did and we had RHAT, AMR, AMD and, for a brief time YHOO. We broke even on AMR because I chickened out on it and when it came back to my buy point (plus some to cover round trip commissions) I sold it. Had I held it I would have been four for four and that would have been great. I bought YHOO just before noon off a "buy me - please buy me" formation - see if you can pick it out.


Hint - look at the candle formation at 11:30 followed by the one at 11:45. AMD I bought off the narrow range bar at the second 15-minute candle and the fact that the SMH (the semiconductor holders ETF) was going ballistic in the second 15 minute period. RHAT was also bought off the NR bar in the second 15-minute candle. I dumped both RHAT and AMD at half past noon and that was a little premature for AMD but just about right for RHAT.

YHOO I dumped at 3:45 for a nice little profit - kind of a desert off the morning's meal.

Tomorrow is shaping up as a potentially bullish day - the up/down ratio is 34%, the new 20 day highs have backed off to 534 and the new lows hit 271. All three sisters finished the day in the white and that is always a good sign when coupled with the up/down ratio. The VIX stays neutral - hardly moving at all. My newest market proxy - Goldman Sachs not only finished the last hour in the white but it also finished the day green. As a result I'm giving the magic coin the day as a bullish day because even though it started off down it came back strong in all regards.

That makes the score 18 and 6 which is fantastic for a coin flip - for tomorrow it says .... tails - the bear is coming. Oh, it's just a coin for crimenelties sake!

Tuesday, October 10, 2006

Tuesday Wrrrrrrrappppp!

As promised I took the day off and a good day it was to do that. For tomorrow we see more of the same - the up/down ratio is 44% and the new 20 day highs and new 20 day lows are pretty much the same as yesterday.

The DIA finished in the red, the SPY finished with a doji and the Q's finished with a strong white candle. The VIX lost the 11 cents it gained yesterday and that puts it firmly in the neutral zone. There is no there there. I.E. more of the same-o.

The magic coin is 17 and 6 having missed today - for tomorrow - heads - bull coming. I think so too.

Monday, October 09, 2006

Monday Wrapata Wrapata Wrapata

If GS is a proxy for the market then the market did well today as did I. Took positions in AMR and DHI in the midmorning time frame and made some from both of them. This patience thing is really paying off. DHI and AMR are old friends and if I have a choice between stocks I know and stocks I don't I'll usually go with the ones I know. It is comfortable that way. Both trades were taken off gap-down set ups - AMR off a piercing arrow and DHI off a narrow range bar followed by a red hammer on the 15 minute charts.

Tomorrow is shaping up to be more of the same - let's face it no bad news can possibly shake this market.

Two of the three sisters finished the last hour strong and the third, Q's, did a doji dance. GS finished up strong. The up/down ratio sits at 50% which is a big Idunno and new 20 day highs increased to 866 as new 20 day lows remained low at about 184 only 4 different from Friday's close. The VIX remains neutral but what's new with that - volatility as a whole is down which suggests more of the same more of the same more of the same.

Meanwhile silly magic coin is 17 and 5 having called today correctly. I wrongfully gave Friday to the magic coin and shouldn't have so I've had to back it off at the top and add on to the bottom. Still impressive all told. For Tuesday - tails - the bear is coming - just as well as I'm taking the day off.

Saturday, October 07, 2006

GS As a Market Proxy

I read in the Shark Report, which is a very good trading BLog, that Bennet Sedacca of minyanville.com (which I have never read) is suggesting that Goldman Sachs is becoming a market proxy. When I read stuff like that I have to check it out on my own and low and behold I can pretty much confirm the suggestion.

Here is GS overlayed with SPY on their weekly charts. Note that the two dance together very nicely.


But also note one more critically important item - GS volatility is much more visible than is the SPY's. That is very important. It is important because you can use the volatility indicator (or lack thereof) to signal market turning points. When the volatility goes out of GS - and it is obvious when that happens then, in most instances, we are coming up to a major turn in the market. Note that volatility has just increased in GS after a period of low volatility - and it seems to be turning up. What do you think that means?

Itsa Friday Wrap

A weakish day but not too weak. More or less as expected for a change. I didn't do very much but I did take an opportunity trade which was right after GM took its plunge and I saw that it appeared to overshoot and made a "buy me" formation. A little while later it followed with a "sell me" formation and I made a quick 80 cents.


This is an opportunity trade in that I happened to read the headline where Kerkorian's man quit the board and then looked at the chart at the right time in the right venue (4 minute bars). I wasn't considering a trade but the set-up (a piercing arrow hammer at 30 past) was so sweet I had to get on board.

It is possible that the current run will continue. The up/down ratio dropped all the way to 35% and the new 20 day highs pulled way back to 582 from 1234. Of course the new lows went nowhere and that might be a good thing. It might suggest a certain amount of internal strength to the market. The VIX remains neutral. The three sisters all finished the day off their lows - all of them starting their recovery right after noon. It appears to me that the volume in the afternoon was just as strong as in the the morning so yes I'd have to say that a recovery was in process.

Now the first week in October generally is a down or sideways week and this was anything but so I think (emphasis think) the market as a whole could continue its upward trajectory.

The magic coin is 18 and 5 having called Friday a bull which it was since every major index finished up and white. Next time ... heads - bull again.

I'll be back later this weekend with another post about Goldman Sachs and how it might be considered a proxy for the market as a whole.

Thursday, October 05, 2006

Thursday Wrapping the Fish

What a stinky day - actually strange - I took positions in RHAT and BGO (a gold miner) and made a little bit of money in each of of them. I expected the market to go down and it went up. I don't know what is powering this market but if it wants to go up - go up it will.

The numbers however say it shouldn't. The up/down ratio remains at 60% and there are 1234 new 20 day highs vs only 126 lows. That in and of itself should make the market go down - there literally isn't anything left to buy. The VIX remains neutral and the three sisters finshed the last hour in the red, but weakly. Who knows?

Maybe the magic coin - it's now 17 and 4 having called today correctly. For tomorrow ... heads - bull market again.

Buy Me Buy Me Pleeeease Buy Me!!!

Every once in awhile I come across the classic "buy me" formation. Actually this happens a lot more often than you might think. A down sloping day followed by a gap down that doesn't stay down and forms a long tailed hammer and then away it goes.

When you see one of these you can be fairly certain (80% or so) that it will go up. I like waiting until the third candle (and in this instance actually waited until the 5th) for a confirmation. I bought this off the "retreat to 8" set-up that I like so much which actually gave the trade a much higher probability of success.


Class dismissed.

Wednesday, October 04, 2006

On Wednesday We Wrap

Not too bad - took positions in RHAT and DHI which are two of my favorites. Made some in both of them though I got out of RHAT too soon (how often I write those words - despite my resolve I can't help but run with a small profit if the trade looks to be turning on me). Regardless a profit is a profit.

Tomorrow who knows - the up/down ratio is 66% and the new 20 day highs vs lows is 1104 to 220. But the VIX stays neutral and the three sisters finished strong white.

I think it is a toss up and I refuse to call it. We'll just have to wait and see.

Old magic coin is 16 and 4, two misses in a row - for tomorrow - heads - bull market - who knows.

Tuesday, October 03, 2006

Another Crappy Tuesday Wrap

The title says it all - I made about $18 today on three trades because I got out of two too soon and one too late. Didn't lose money on any of them just whipsawed by a dumbass market. I have no idea what is going to happen from here - the up/down ratio stays below 50%, there are 200 more 20 day lows than highs and the 20 day lows are greater than 600. The VIX remains in neutral territory. Meanwhile the three sisters although closing green actually finished the end of the day in the red which is always a bad sign.

I expected the market to finish strong at the end of the day not start strong and then fail. I think tomorrow it reverts to form and goes down - no matter I'm flat.

One of the stocks I traded were AMR on the oil decrease. It was steaming up and then the pilots union started screaming about raises now that the airlines are recovering - what a bunch of jerks - I sold at breakeven including commissions. I also played CSCO off the 4 minute charts where the 4 EMA crossed the 21 EMA going up. I dumped it at about a dime because I didn't think it was going anywhere and it turned around and continued up. I had H for awhile until the collapse this afternoon where it dropped and stopped out. Fortunately I had moved my stop to a profit level about 14 cents above my buy point. What absolute crap.

The magic coin is 16 and 3 since it missed today. For tomorrow --- tails - bear again. I agree this market has got to go down in order to get some volatility.

Volatility – We Don’t Need No Stinking Volatility

Although October is traditionally thought of as the beginning of the season for stock market returns this October we have a small problem. That problem is volatility. Many a scholar, most more scholarly than I, have shown the relationship between volatility and price. The best of these, of course, is John Bollinger of the world famous Bollinger Bands. If you don’t use Mr. Bollinger’s amazing method in your analysis then shame on you. I suggest you get his book and start studying now. The most important thing among many important things that Mr. Bollinger said was – “low volatility begets high volatility and vice versa.” I’m paraphrasing but that is the essence of the message.


The figure shows how the VIX and the SPY interact across relative to their own volatility. And how the SPY reacts relative to the VIX. In this 6-month period (through yesterday 2 October 2006) I’ve outlined 5 regions of change. In the “A” region we see a period similar to now (“E” region). The SPY is flying high and the VIX is running low. The volatility bands are narrow for both articles. In the “B” region volatility begins to expand and the VIX rises as the SPY falls. Note that the VIX did not cause the change but the violent downward price action of the SPY caused the bands to expand. Note how towards the end of the “B” region the volatility bands for both the VIX and the SPY begin to contract once more indicating a dampening of volatility for both indices. There is a mild transition through “C” and “D” leading into the “E” region.

While bands can stay contracted for awhile the fact is low volatility as is seen here must give way to higher volatility or the market will end. Volatility is the pulse of the market without it there is no market. Consequently I think we are in for a period (weeks not months of volatility expansion) before this market can go much higher.

Monday, October 02, 2006

Moday Wrapping

Told ya so! Well that was pretty easy actually - There really isn't anyone around so the market goes down. I took trades in DHI and VRSN today both of them off a narrow range bar set-up early on and both of them proved profitable.


This set-up is a good earner. It is simple - a gap down followed by a narrow range bar (NR), confirmed on one of the next two bars with a hammer or hammer-like formation and then a buy on the breakout. I like waiting for a healthy confirmation but either of these trades could have been taken sooner. I use the lowest low previous to the NR bar as my stop.

You can see how both these trades ended with the market collapse around 1 P.M. I was watching them fairly closely and they stopped advancing well before I sold and I probably sold a few cents late but none of this is rocket science - you go in when you feel comfortable and you leave when the comfort leaves.

I like playing gap downs more than I like gap ups. I can play the gap up but only when the price pulls back to the EMA 8. The next time I get one of those trades I'll share it with you.

For tomorrow we are looking at a moderate start, a bottoming of the indices in the first 2 hours and then an explosive finish to end the day. I base this all on nothing more than intuition and instinct and we all know what that is worth.

The up/down ratio sits at 33% which is excellent - the new 20 day highs went down to 313 and the new 20 day lows went to 478 - a huge jump from 324. Unfortunately the 3 sisters all finished the day in the red. That is a weak indicator however the strongest indicator is the up/down ratio which is sub 40% for the second day in a row.

Little magic coin is 16 and 2 since it once again called today's action perfectly - for tomorrow it says ... tails - bear again. Ok - but I'm not betting the farm on it.

Monday Monday How I Hate That Day

If the 2 hour charts are any way to tell, and they are, we are in for a couple of down days (or maybe just one). Now I'm not in the predicting business but every once in awhile I see some things that scream - here's what's happening - and these three charts tell the tale clearly.


See what I call "steeples"? I call them that because they remind me of seeing towns in Europe from a distance and the only thing you saw at first were the church steeples long before the town itself became clear. I think the Japanese dubbed these castle tops or something like that.

These are generally topping indicators although they could also be indicating a consolidation. There are two other examples in the figures (from prophet.net - an excellent site) of the steeple formation. I've also noted a couple of set-ups for future reference.

I like the 2 hour charts as indicators because the period is long enough to make sense of the nonsense but still short enough to be useful for day trading. Now, of course, you don't have four 2-hour periods in a single trading day. So even though they are two hour charts the last one is actually only a half an hour. (Actually, in this case, a little longer because these instruments (SPY, QQQQ, and DIA) don't settle until 4:15 - but that's another story).

Sunday, October 01, 2006

Thursday/Friday Wrap It Up Day

A nice little vacation away from the madness of !!!!***DOW HITS RECORD***!!!! and although it did it really didn't and I can see by the volume on the DIA that the insanity is nearly ended. Going from 13 million shares on Wednesday to 6 million on Friday is a good indicator that most the the a-holes in the pits are bored with this little game.

Anyway it looks to me that the market is now poised to make another run since the up/down ratio has receded to 39%, the new 20 day highs are less than 400 and the new 20 day lows are increasing. The VIX continues its march in the deadband (+/- 5% of its 10 day moving average) and the three sisters all took a well deserved rest in the last hour on Friday and closed in the red. Given the interest on the day that is not surprising.

October is a strange month - it is the transition from Summer to Winter and most of the markets gains happen through late Fall into the Spring. In 2 of the last 6 years the market (based on its proxy SPY) has finished down in October so October mostly finishes on an up note. In the last two years the first three weeks went down and the market then recovered momentum in the last week. Three years ago we had a first week up, next two down and the fourth week up. So October is hard to predict except that generally speaking the market will finish the month up.

But one has to be careful in October - some of the worst single day crashes in the market have occurred during this month. Not lately but there have been some big ones in the past.

The magic coin is now 15 and 2 because I'm going to say Thursday was definitely a bearish day since two of the three major indicators (DIA, SPY and QQQQ) finished below Wednesday. Friday there was no call. But for Monday the little bugger says ... tails - bear in the air. As always, we'll see - I can hardly wait.

Thursday, September 28, 2006

Where Are The Bulls

Jim Cramer says that there is always a bull market somewhere and he will find it for you. Well you don't need Jim Cramer. Just go to stockcharts.com and set up a page called SPYDRs. On that page put the 9 ETFs known as SPYDRs. These are XLF - finance, XLK - tech, XLI - industrial, XLB - materials, XLE - energy, XLU - utilities, XLV - medical care, XLP - consumer staples, and, XLY - consumer discretionary. With those charts put some measure of overbought/oversold such as Slow Stochastics and watch the indicator. When everything but one or two are overbought attack those sectors that are oversold. This was XLE and XLU on a recent occassion (like for the past 4 weeks or so). You wait until one of the major indices such as OIH shows a turnaround and then move your assets to that sector.

If you do something like this you will always know where the bull market is coming next.

Wednesday, September 27, 2006

Wednesday Wrapped

Took positions in VRSN and RHAT today. VRSN set up to look like it was going to break out and didn't. RHAT dropped 6 bucks off an "in line" report (isn't that the dumbest ass thing you ever heard of) and also started looking like it was going to hit the offer. Then the entire market levelled off and fell and bounced around a bit and I wound up with small losses on both of them.

All in all the moron's on CNBC will report a successful day - I say it was just crap. Of course there were several opportunities that I passed and that worked well but I already had my quota for the day.

Tomorrow is shaping up to be another dull day and that dullness will probably continue through Friday. I'm tired and I'm going to take the next couple of days off.

Anyway the three sisters all finished in the white today but the up/down ratio stays above 50% but not too bad - 52% - which is a neutral reading. The 20 day new highs pulled back but so did the 20 day new lows - a real barn burner of a day.

The VIX remains solidly in neutral. Coupled with the fact that this week is historically up and I believe both tomorrow and Friday will be bullish but not extremely so.

Stupid magic coin is 14 and 2 (nobody is that good - nobody) and for tomorrow it says - - - tails - bear a comin'. Could happen but I believe Friday will finish the month up strong. We won't know the magic coin's take since I only spin it once a day.

Tuesday, September 26, 2006

Rap That Tuesday

Interesting day - started out strong collapsed under the weight, rolled over and went up. I played VRSN but entered too early so I didn't make as much as I could have had I waited. Tomorrow I'm waiting. If I don't make a play then I don't make a play but I am going to wait it out.

The interesting thing is this - when the three sisters go parabolic first thing out of the shute you generally expect them to roll back for awhile and that is what happened today. Nothing less nothing more. This is what it looks like. The third candle linked with the first two indicates a too strong opening. Then it looked like the price was going to retreat to EMA 8 but the open was so strong it went all the way to EMA 21. When it bounced off EMA 21 you could be pretty sure that it would go up the rest of the day.


We have mixed signals - the three sisters all finished strong white but that is a weak signal. The VIX remains neutral and that is a nothing signal. The up/down ratio retreated 2 percent today to .54 but the new 20 day highs extended by a hundred plus to 746 adn the new 20 day lows decreased to 237.

I think we are going up again tomorrow because I think the week of the month and quarter trumps everything else. The fund managers have an opportunity to make some points and they aren't going to pass the chance.

The magic coin is 13 and 2 having hit another homer with today's bullish behaviour and for tomorrow -o-o-o- heads again another bull day.

Monday, September 25, 2006

Wrapping Monday

As expected the market goes up. I made some on AMR and RIO but not as much as I could have because I was impatient to get the buy in and was well off the low of the day. Oh well - patience is one of my weaknesses and I really have to practice that more than anything else. This is the one weakness that kills most traders - impatience. Too quick to buy too quick to sell. It just takes discipline nothing more - most people don't have it and most people can acquire it.

Tomorrow should be a sideways kind of day - the up/down ratio is back up to 56% and the new 20 day highs are once again outpacing the new 20 day lows by 637 to 430 - still that's quite a few lows so I think sideways up could be expected. The VIX remains neutral but all of the sisters finished the last hour in the red. That is generally a weak sign. This week in September is generally pretty robust as the fund managers are looking to make some coin before the end of the quarter.

The magic coin is 12 and 2 having nailed today perfectly and for tomorrow says ... heads - again - another bull day.

Saturday, September 23, 2006

Volume Sometimes Leads to Funtimes

I'm not a great believer in volume because it is a meaningless component unless taken in such large quantities that everyone notices. But I do use volume as a filtering mechanism in that I want high volume stocks to ensure high liquidity (quick in quick out). I do believe in moving averages however and especially exponential moving averages. I think the EMA 90 is where the boys become men and I have made a lot of money doing what I call "riding the EMA 8" which is where a stock just goes up staying in close contact with the EMA 8.

Then I was doing some investigation of stocks that seemed to start going up and never coming down such as HANS and a couple of others and I saw one thing very quickly - in the monthly charts of such stocks there is a decided change in the volume several months after the first indications of rise occurs.


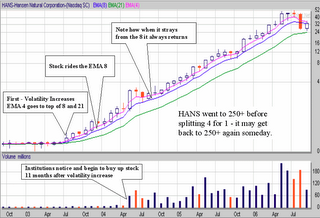
That means that institutions have taken notice of the stock and from here on out the original buyers are on easy street. There is no easier way to make money than to own a stock that funds must have.

This got me thinking - is there a possibility on a shorter term to get some action out of volume and the EMA 8? So I designed a filter -

show stocks where close is between 15 and 25
and close > ema(90)
and close 3 days ago < ema(8)
and close > ema(8)
and average volume(90) > 2500000
and average volume(15) > 4500000
and draw ema(21)
and draw ema(8)

All I'm asking for is a stock that is crossing over the 8-period EMA and who's volume in the past 15 days is about twice its normal (90 day average) volume.

I back tested this filter and came up with some interesting statistics - in the period from August 9th to Friday the 22nd of September the filter was right 69% of the time to 29% wrong on a 5 day basis. I will take a filter that gives me a 7 to 3 advantage over 5 days every day in the week.

To validate the filter I removed the line and average volume(15) > 4500000 and reran the test in the same period. I achieved 60% to 40% results. But the more interesting component is that with the original filter the ROI was 57% and with the modified filter it was 4%. That is an incredible difference and is of significance.

The filtering software I use is from stockfetcher.com and I get nothing from an indorsement so I suggest you try them out. The charts as in most instances come from prophet.net which I still consider to be an excellent site. Again no indorsement comps but go try them anyway. The annotations on the charts are done by me in power point - there are other, perhaps better packages but I am most familiar with good old power point.

IWM Crosses SPY

The small cap index (represented by IWM) crossed over the large cap index (represented by SPY) about 10 days ago and I missed it. Actually it doesn't matter much to me who leads who but some people find it fascinating to talk about "Big Cap Big Cap Big Cap No Small Cap Small Cap Small Cap" and this,to me, is like arguing the merits of pink or yellow.

But what is interesting is how they both turned on the same day back in August but since then Small Cap has outperformed Big Cap. Small Cap, of course, has been the leader of this particular Bull Market and this is one thing that the tech worshippers and the Big Cap worshippers can't seem to grasp or understand - it is possible to have a bull market without either of those.

All the necessary information is on the slide. What you are looking at is my proprietary method of making sense out of nonsense called Marlyn's Curve - I've written about that somewhere in here and I'm not about to go find it.


But as always I save the best for last and here is a picture of the Q's with the IWM and the SPX and you can't help but notice that 1 - tech rolled over going up about 7 days before either of the other two and 2 - it has gone higher. In fact over the last 37 days tech has returned 9.2%.


During that period of time I have read numerous BLOGs bewailing the fact that tech is going nowhere, you can't have a market without tech, blah blah blah tech but the proof is in the picture (worth more than a 1000 blogs I might add). And the proof is that those dimbulbs really don't know what they are talking about - but you knew that because you always remember the sacred rule number 1.

One other thing you might care to notice - the Q's recently rolled over going down as has the SPX and the IWM. Be careful for the next couple of weeks or so. Marlyn's curve operates on about a 20 - 30 day cycle and it is suggesting a certain amount of weakness in the market as a whole.

Friday, September 22, 2006

Friday and That's A Wrap

Made a bit on AMR this morning. Got on board using a method I call Two White Angels at 10:45 - 11:15 (see the chart and you'll see what that looks like). Got out 45 minutes later at the high of the day. That was pure luck - (high of day that is) - I wanted out at that time because I was done for the day.


I saw a couple of other potentials but when selecting between stocks I normally go with ones that I've played before.

The week ended just fine and met all expectations - i.e. a down week following expiry in September. Next week should be up if history is to be our guide.

Two of the three sisters finished the day in the last hour with white candles and the other one, the Q's, finished with a doji - although I'm not sure what it is resting from having done nothing all but go down.

The up/down ratio dropped some more to 31% and there are 549 new 20 day lows to 233 new 20 day highs. The VIX even went 5% over its 10 day average and all of these things together generally indicate an up day coming.

The magic coin is 11 and 2 having yet another winning day today and for Monday says ... heads - bull market.

I'll be back later this weekend with another filtering method that shows promise.

Thursday, September 21, 2006

Wrap Me Thursday

What a crap day. Of course we predicted a down day yesterday and were expecting it but that isn't the reason for the glum - some analyst downgraded DTV before the open and I had to scramble to get a break-even. I bought at the bottom of the drop and because I averaged down I was able to sell at a break even price - don't ever do this. Once more I repeated my mantra - day trading means trade in the day not overnight.

I bought RIO and H and made some on both of them so the day wasn't a total loss - then I went and played golf.

Tomorrow we are up. The up/down ratio which is still proving to be the best "tell" is at 35%, the new 20 day highs printed 365 and the new lows 402 which is the first time the lows have outpaced the highs in awhile. The three sisters all finished with strong white candles and the VIX remains in neutral territory. These are all bullish indicators.

The magic coin nailed today and goes to 10 and 2 and for tomorrow says ... tails - bear market.

Well we disagree - we'll see.

Wednesday, September 20, 2006

Wednesday We Wrap

Read somewhere today that it "isn't a good time to buy stocks." I don't know - in my opinion - it is never a "good time to buy stocks" but it is always a good time to buy "stock".

There were a number of stocks that made substantial gains today. All of the indices increased and 7 out of the 9 spydrs also improved (energy and utilities being the exception).

Most of us (me especially) really suck at calling the bottoms but I'm pretty good at recognizing a stock that might go up a buck or so after it has bottomed and started back up.

I can't help but notice that the SPY is only 12 points away from its all time high and the DIA has been making new all time highs almost daily for months. Only the Q's are lagging but - who cares. During the past 30 months or so we have been in an obvious (but weak) bull market without tech so why can't it continue? Besides - who cares - ORCL posts a massive number yesterday gets a bump today and there it sits and will probably sit right there until its next earnings announcement. I.E. - who cares - tech stocks are commodities and servers and networks are a dime a dozen - literally. We've had bull markets without tech for years and years it will happen again.

During the run up in oil during the spring it was noted widely that the buying was mostly speculation and isn't what is happening what usually happens with speculation? A crash. Same thing is going on with gold and other precious metals.

I kind of figured that the game was over for both gold and oil when they didn't go parabolic after the most recent Iran/Iraq/Israil/ Hezbollah/al-Quada crisis.

So when is it a good time to buy stocks? Today was a good day but you had to play early. After 11 or so volatility dried up and even the expected Fed announcement couldn't shake things up. Still 4449 stocks finished above yesterday's close and that is 57% on the up/down ratio scale. 1039 made new 20 day highs which is 600 more than Tuesday and 371 made new 20 day lows which is 4 more than Tuesday.

The VIX moved back into warning territory (5% below 10 day MA) and the three sisters all finished with doji candlesticks. Doji as readers of this blog know (thanks Mom) are a resting indicator. But I think we should have a down day tomorrow and Friday.

The amazing magic coin is 9 and 2 because it was definitely a bull market today and for tomorrow the coin sees ... tails - bear market. We agree again.

I replaced my position in JBLU with one in DTV. I think it has a little run left from the one it began Friday. I'll probably hold this for a couple of days regardless of tomorrow's action and see what happens. Here's the chart - see if you can spot the bottom.

Tuesday, September 19, 2006

Tuesday in a Wrap

I love it when a plan comes together. Actually I had some things to do this afternoon and I left about 12:30. In my absence JBLU went up. That was because oil came down - at least for most of the day. Oil (in the persona of XLE) now appears ready to go back up. Hopefully when the FED announces I'll be able to get out of JBLU with a substantial profit and those of you holding oil will also make some.

Tomorrow is looking like a good day - the three sisters all finished the last hour strong and the VIX is back in neutral territory as are the new 20 day high (453) and the new 20 day lows have increased significantly to 367. The up/down ratio which I feel is the best tell of all is at 36% and that suggests a big day a-comin'.

I'm not a perma-bull nor a bear - I'm just a trader and I play the market the same as my golf ball - as it lies.

The magic coin is now 8 and 2 since it predicted a bear market and every index went down today. For tomorrow ... bull.

This is no bull folks - I spin the coin once a day and where it lands is where it stays until the next spin tomorrow. We'll see.

The Incredible 3 Candles

Actually it could be a couple more than three but generally three will suffice. I call this set-up "retreat to 8" in that the price is closing on the 8-period EMA.

How it works is simple - a gap up followed by a decline or sideways move towards the 8-period EMA. This culminates in a hammer or (hammer-like) object or narrow range object (as shown in the figure both the 3rd and 4th candles are narrow-range objects) and then with a touch of the EMA 8 (5th bar in the figure) the price takes off.

The color of the first bar can be either red or white as only the gap-up is required with a subsequent move back to the 8-period EMA.

I normally use the 15 or 30 minute charts in my trading but I have seen this set-up on just about every time frame including weekly. The arrow pattern to the right in the figure shows the method clearly.

Monday, September 18, 2006

Monday - It's a Wrap

IMO oil was a one day story - today and tomorrow we will be back to normal or what passes for normal these days. In addition, the Fed is going to pass on interest rates again this time around and lower a quarter right after the election to smooth the holidays for the retailers.

A pass on interest rates on Wednesday means a boom is coming so I hope you will be positioned to take advantage of it. The best position, of course, is out of the market and taking a nap when the announcement is made. I'm going to hold some JBLU through the announcement with the hopes that I'll catch a significant bounce. Actually I'm hoping that oil will retreat tomorrow and JBLU which moved about 20 cents today will move a half tomorrow in the right direction.

The VIX barely moved today and the three sisters finished the last hour painting white candles. The up/down ratio is 44% which is a little better and the new 20 day highs have returned to 641 from 873 on Friday. The new 20 day lows however also declined from Friday to 225. All of which is suspicious and again indicates that there just isn't much out there worth a bid. My guess a sideways market again tomorrow with some bullish inclination.

I'm going to give the magic coin today because he was almost right which makes him 7 and 2 and far better than your faithful correspondent. For tomorrow the coin says ... tails - bear market.

We'll see.

Saturday, September 16, 2006

Patience is a Rule not a Virtue

I am too impatient when I'm trading (among just about everything else) That is a fault that I have to work to overcome. I made three charts to put up on the wall of my trading station room so that they will always be in front of me. Some people such as myself need constant reminders until it takes effect. I chewed nicotine gum every day all day long everywhere I went for over 18 months until I finally was able to give up smoking. In that time I never took a cigarette, pipe, cigar or any other kind of tobacco but I chewed the gum. Today I am smoke free for over 5 years after being a nicotine slave for over 30. Anyway here are the "patience rules"


These are self-explanatory and you are welcome to copy them and use them for yourself.

Oil Me Up

If I were a betting man I would bet that oil would be a good bet this next week. I am a believer in follow-through, or, if a stock is going up it should continue to go up until it doesn't and vice versa. I was just looking at the oil spyder XLE and it appears to me that it missed an opportunity on Friday to go down. In fact it showed how tired it was of the trend with a doji. While the doji is not necessarily a bottom indicator if XLE goes above 52.50 on Monday I'd say it was a good bet to take another run.


This was also confirmed by the OIH (oil holders ETF) on Friday. Again an opportunity to go down and instead it went up and is showing a consolidation. 126.50 on Monday would be an indicator that it might be coming back.


Charts from stockcharts.com - an excellent site.

Friday Wrap-Up

Late - as usual - had some things to do - sorry.

Played AMR right out of the gate and made a nice, easy, quick score. Then replayed it later and made a nice, slow, painful loss. Even for the day but had I quit in the early going with my profit I would have been just fine. I'm developing a set of "patience" rules. I'll share them later this weekend.

An awful day all told and not just because of the loss. I have to remember not to play expiration Friday. It truly is a low volatile crappy day all around. The SPY actually tells the story with greatest clarity - where the DIA and Q's both gapped open and stayed up most of the day the SPY opened up and immediately closed below the previous day's close. For all three sisters it was a roller coaster from there but mostly sideways down. All three ended the last hour in the red. Here's how the SPY looked on the 4-minutes - the others had a similar pattern.


The up/down ratio stands at 50% which suggests that some stocks caught a bid off of Thursday's performance and the new 20 day high vs low prints 873 to 332 or not much change. The VIX continues to recede towards its 10-day average however which suggests that the fear is leaving the market regardless of the internals.

They say (the ubiquitous "They") that the week after September expiration is generally a downer. In 4 of the last 5 years "they" were correct. Who am I to say "they" are dumber that the dumbest dog on the darkest night? Nobody that's who. So let's "go with the flow" and see what happens. I think we are in for a small correction. We'll see.

The magic coin is 6 for 2 (I'll give him Friday even though it was so flat) and for Monday he says ... heads - bull market coming.

Friday, September 15, 2006

Stop Crying

In the past month somebody (not me) made a ton of cash selling oil, nat gas, and metals to the retail trade (let's hope it wasn't the all knowing fund managers coming late to the party). That means that a lot of cash is out there to be put back to work - where else except a rotation into (select) tech?

While tech is going up it isn't booming nor is it universal. But when little crap companines such as FNSR start catching a bid you know something is up. When ORCL starts burning you really know something is up.

The airplane patch is also catching a some bids - I'm making my year from stocks like AMR. This is probably because oil is going down - but I don't care why. All I know is that the charts say - "buy me".

Now I could sit around and ask "whyyyyyy" or I can take a few bucks and make a few bucks. And since that's what I do - that's what I'm doing.

I've lost a small fortune trying to predict the bottom in anything and outguessing the market - I've made a small fortune just going with the flow. There's a river of money running through this box (computer) in front of me and everyday I reach in and try to catch a couple of Benjamins. I'm not bothered with the "why" part of it anymore.

And though I may turn the air blue with a stream of invective every now and again - I never cry.

Thursday, September 14, 2006

Thursday Wrap

AMR again. Another nice profit - not as good as Tuesday but at least half. Not enough to make me take another day off so I'll be back in the mines again tomorrow.

As for tomorrow I think it should go up. Options expiration day be damned. The up/down ratio (which is proving to be the best tell of all) prints 37% and the new 20 day highs vs lows shows 640 to 323. The VIX is coming back from being way oversold or overbought (I never get that right) and all three sisters printed white candles in the last hour. In fact if it weren't for that they would have all finished down for the day. The volume is still weak however and that is not a good sign. But the evidence points to an up day - maybe not a strong day but an up day.

The magic coin called the day and even though the three sisters were only up a few cents it still was a bull market. He sits at 5 and 2 which is far better than I am doing over the same period and for tomorrow he says ... heads - bull market.

Still working on the 2 hour method - I'll get back to you as soon as I have something positive (or negative) to say.

Wednesday, September 13, 2006

Wednesday Wrap-Up

My tradition is to take a day off after a big win. That is because I have found that I can piss away a profit faster than I can earn it. By taking a day off the desire to trade recklessly subsides and I can approach the market in a calmer manner again. Today was a day off.

It was a weak day even though the averages were up strong. Tomorrow should be moderate to down and Friday should be dead even because this is, after all, expiration week. The up/down ratio sits at 56% - down a bit from yesterday and the new high/lows printed 1137 to 139. Once again we are in a position where we need a couple of down days just to find something to buy on the bull side. The VIX continues to decline and sits at 12% below its 10 day moving average which is always a cautionary moment. Two of the three sisters finished the day in the white (Q's and SPY) but neither one of them showed much strength.

The magic coin is 4 and 2 and for tomorrow it says ... heads - bull market coming.

One-Way Directed People

I don't rant often but I just ran across a web site written by a prolific writer who seems to have a (wrong-headed) opinion about everything. Maybe not wrong headed but definitely one-way directed. As they say even a broken watch has the correct time twice a day - so it is with this guy - every once in awhile he is probably correct in his one-way of looking at things.

I wondered WTF until I noticed that he hailed from Kansas and all of a sudden things became crystal clear - Kansas - OK - what else comes from Kansas - hot air and bull snot - and that explains a lot of things.

Kiddies - remember rule 1 - nobody knows nothing - including me. So be careful out there - this guy makes his living as a financial advisor and I wouldn't take his advice about anything including what toilet paper to buy or what color to make my place mats. He is - in short - a dumb ass as are all one-way directed people especially those from Kansas.

Tuesday, September 12, 2006

Tuesday Wrap

Nice ride today. I had AMR and made a serious amount of money from it. But just about anything except oil and metals was good today. I like days that require no skill just courage.

Tomorrow is shaping up to be a bit of a down day. The up/down ratio sits at 65% and there are 1194 new 20 day highs to 326 new 20 day lows. The VIX is in fear territory again and the sisters closed with red candles. If it doesn't go down I wouldn't be surprised if it went sideways.

The magic coin is 4 and 1 having called for a bull market today. For tomorrow ... tails - bear market.

We'll see. I'll have another installment of the 2-hour charts later or tomorrow morning.

2 Hours to Profits

Well that's a bit of a stretch but if it got your attention then it's a successful headline. My reader, hi Mom, liked it so what do I care if you do or not. Anyway, as promised, here is the first chapter of using the 2-hour charts to develop trades.

The 2-hour charts provide a wealth of trading opportunities. Once you get a positive signal you can almost trade with carefree abandon - although I don’t care to even think about that because it hurts my head. Let’s review the bidding.


1. A Doji star suggests a bottom. The next day a hammer is printed in the 1 - 2 P.M. time frame. A purchase here at $24.00 can be held (overnight) for a $1 gain.

2. A Doji star suggests a bottom. The next day gaps up and the purchase can be made after the first 30 minutes or so at about 25.20. Sell again after $1 gain at the end of the day.

3. A gap down that immediately starts going up following four red candles of the previous day. A buy at $24.00 (again) can be sold at the red hammer end of day indicator of $24.60.

4. The previous day’s red hammer end suggests a wait and see but the next day starts out with a gap up, a brief pull back and then a follow through to the end of day. A purchase around $25.00 could be sold at $25.80 for a nice profit.

The 2-hour charts provide opportunities but you have to be patient and only take the trades that make sense. The reason that the 2-hour charts make sense is that once the trade develops it continues to run long enough to make a profit from it. Generally speaking we want to take the trade off a signal from the previous day’s close. A Doji or red hammer or even a white hammer below the EMA 8 is enough to keep us interested. In the third case (3) we will try to take the next day's start off the four red candles of the previous day.

Note that this time we didn't have any short sales, that's because in this example we didn't have any absolute top indicators. In future posts regarding this topic I'll show some shorts.

Needless to say (but I will anyway) this is just a set of suggestions - you must practice first before you use any of these ideas to try to make some money. But the 2-hour chart method is looking promising.

Monday, September 11, 2006

Monday Wrap-up

Made five trades today and made money on all of them. Took positions on ALTR, ATHR, CHKP, DHI,and SYMC. Maybe I have my mojo back. But and this is a big but - five trades are three too many so I have to watch my step.

Tomorrow should be an up day. The up/down ratio sits at 38% there are 655 new 20 day lows vs 486 new 20 day highs, the VIX is way back in neutral territory (+/- 5%) and the three sisters all finished with white candles. All of that spells an up market.

The magic coin is now 3 and 1, it called for a down market today and missed. For tomorrow the coin says ... heads - bull market.

We'll see.

Anyway I've been doing some research on the 2-hour charts and I think I might have some good information there. If it pans out I'll do a posting later tonight or tomorrow with my preliminary findings.

Sunday, September 10, 2006

Back From Vacation

Looks like I didn't miss much. Thursday's volume picked up a bit and the market slid a bit. Friday's volume returned to what has become normal of late (anemic) but the market went up a bit. But I think we are going up Monday - there just isn't much more that can be sold because there are going to be a lot of buyers.

The stats are simple enough - the three sisters all closed with red candles but they all finished the 2-hour charts on Thursday well below the 20 EMA.

The up/down ratio is about 53% which is a strong turnaround from Wednesday and Thursday and the 20 day high vs 20 day low stands at 425 to 421. The VIX is below 5% away from its 10 day average. All of this is suggesting a short term bottom is forming or has formed so I'm looking for an up day Monday.

The magic coin is now 3 and 0 (to my 0 and 3) and for Monday it says ... tails - bear market.

Wednesday, September 06, 2006

Wednesday Wrap Up

I managed to get out of RBAK this morning just ahead of disaster and then, 45 minutes into the day, put another trade on and lost what I made from yesterday. That was just pure stupidity nothing else to say about it. Didn't even have a good set up just didn't believe it could fall that far that fast without a bounce. It didn't bounce for another 2 bucks. I was out long before that but good grief what a maroon!

I won't be in for the rest of the week but based on my reading of the tea leaves it looks like tomorrow will bring a turnaround. Up/Down ratio sits at 21%, and new 20 day high vs low shows 251 to 356. The VIX, while not completely, is nearly 10% higher than its 10-day average.

The three sisters are showing an interesting formation - in the last two hours of the day a white candle or doji below the 21-period EMA. This is proving to be a winner in single stocks as well and I plan to expand on it in the near future for your edification.

Hope you are positioned for it. So let the record show that I'm expecting a bull market tomorrow.

The magic coin is now 2 and 0 and for tomorrow - tails - a bear market. OK - we'll see.

And we'll see you all again on Monday.

Targets for a Wednesday

I'm not sure if this is valuable or not but I'll be watching FNSR, RBAK, RHAT, ACI and INTC today. Will let you know later how these turned out.

Trading Rules

The trading rules are different from the life rules. In the life rules the primary rule is nobody knows nothing - or, to say it another way, trust - but verify, or, to say it another way, if you are in a poker game and you don't know who the dumbass is - it's you. But that's life.

The trading rules on the other hand are far less philosophical. Rule 1 - nobody knows nothing especially you. Rule 2 - every day is a new day with a new start complete with a new opportunity to succeed or otherwise comport yourself. Rule 3 - patience is not only a virtue it is the best money saving method ever devised.

If you understand rule 1 you might even have a chance of suceeding in this game. The reason for that is if you adhere to rule 1 you won't become an arrogant jerk and lose all of your trading funds on a few plays. It took me two tries to discover rule 1 - but I'm slow. I'm still an arrogant jerk which is why rule 2 is necessary but rule 1 reminds me that I don't know anything and I need to learn again with each and every trade.

Rule 2 suggests that there is an opposite to success and that is the most important part of rule 2. That is why rule 2 is written in a way guaranteed to challenge even the most erudite scholar. Rule 2 makes your head hurt - bad trades make your head hurt - rule 2 is a winner. The opportunity that every day presents is to succeed or to fail. Measure your successes one day at a time and measure your failures in the same way.

In the game of golf which is very close to the game of life there is one cardinal rule - never follow a bad shot with a bad shot. Even if it means taking a slam dunk, can't miss baby chip - do it because it will put you back on the road to success and that's where you want to be. In trading you should attempt to never follow a bad trade with a bad trade. But there are no slam dunk trades or are there? In an upward going market there are a lot of stocks that will go up a dime or twenty cents in a very little while. In this day and age of small commissions you should be able to take a successful, break-even trade fairly quickly. Take it, savor the win, and press on. Repeat after me - a profit is better than a loss - any profit - any loss.

Rule 3 was written to supplement rule 2 - rule 3 says that sometimes the best thing to do is to wait. If you don't know how to wait then the first thing you should practice is waiting. If you are impatient you will rush into trades that may prove disasterous. I trade from home. The market opens at 9:30. If I have an overnight trade I wait until the market opens and then make my trade within the first five minutes or so. Then I close my trading station and do something else for the next 30 minutes or so. Most days I shower and shave. I have learned (the painful way) that I have no business trading in the first half hour of the day. Some people make money trading the 2-minute boundaries. Most people trade better on the 15-minute charts and even more people trade best on the 30-minute charts. Patience is not just a virtue it is the key to winning.

There are no other rules that will serve you as well as these. You're welcome.

Tuesday, September 05, 2006

Tuesday

Not bad - I took positions in BRCM, BEAS, NOK and RBAK and made some money in all of them. NOK and RBAK I took after noon in the second wave. I sold out NOK at the close and held RBAK overnight. I think it will bounce in the morning and I'm going to grab a few more cents if it does.

Tomorrow should be interesting - QQQQ and DIA both finished with last hour white candles and SPX finished with a Doji. The VIX remains neutral and the up/down ratio sits at 53% up and 52% up on the 10 day average. The new 20 day highs vs lows printes 1222 to 103. 1222 is getting up there in the stratosphere. If I were to guess I'd say tomorrow is more of the same like today.

The coin flip is now 1 and 0 correct. For tomorrow the magic coin says - tails - bearish.

More Bear Talk

My reader wanted to know if the market was going to go down this Fall.

Yes, Mom, someday the market is going to go down. Sooner or later it will get tired and the tide will roll out. But here is an annotated chart (from StockCharts.com – a great site) that shows all of the “top” calls of the past three years. And, trust me, only a handful of those “expert opinions” have been put on the map.


Obviously the top was called in an extremely scientific and precise manner.

So the next time you hear or read about “head and shoulders” and determine that they are not talking about a shampoo – run for your life. Same with “twin tops”, RSI oversold, MACD divergence, falling on high volume and Tweezer tops. There is no doubt one or more of these gurus will “call the top” and henceforth make his or her reputation. But let's face it - when you call for a cyclical event to occur every other month or so (complete with annotated charts) – you are bound to get lucky every once in awhile.

Sunday, September 03, 2006

Buy the Dips Sell the Rips

Just for fun I back-tested two filters against two separate date ranges - one range where I knew that the market went up and one where I knew that the market went down. The two periods were July 17 through July 28 and June 2 through June 14 respectively. The reason why the periods are unequal in length is that the down period is contiguously down i.e. every day closed lower than the day before while the up period had two down closes in it. So by lengthening the up period to include eight up closes I think they are roughly equal.

The filters were simple – close between 15 and 50, average 90 day volume greater than 500000 and for one – the close was more than 75 cents greater than the open and for the other - the close was more than 75 cents lower than the open. That is – the two filters were exactly opposite in nature on a single day.

The results will amaze and astound you – or maybe not but pay attention anyway. For the up-going period the 75-cent gainer found 150 completed trades. Of these 54% resulted in a net gain. The annualized return on investment (ROI) was –14.81%. That is while the filter found more winners than losers overall it lost money. On the other hand the 75-cent loser found 102 completed trades. Of these 57% resulted in a net gain and the ROI was plus 55%. This proves that in an up going market buying the dips is more profitable than following the money.

But - what about a down going market? Glad you asked.

The 75-cent gainers found 65 completed trades that resulted in a 28% net gain and an ROI of –355%. The 75-cent losers found 100 completed trades that resulted in a 16% net gain and an ROI of –450%. So in a down going market the gainers do better than the losers but both come out to be large losers.

But I dislike ROI as an indicator I prefer the dollar results and here they are.

75-cent gainers up market: -$2.16 (-14.81% ROI)
75-cent gainers down market: -$60.23 (-355%)
75-cent losers up market: $20.77 (55%)
75-cent losers down market: -$178.07 (-450%)

Pretty conclusive stuff – the best long trades from start to finish are the dippers in an upward moving market. The best shorts are the dippers in the downward moving markets.

So it isn't "buy the dips sell the rips" but rather "buy the dips and sell the dips".

Saturday, September 02, 2006

Friday

I'm a little late but was busy yesterday. Let's get the targets out of the way first - three up and two down. That is turning out to be a useless piece of information and I'm going to discontinue it. I took a trade in CHKP that I closed for a small profit because I wanted to be flat at noon and I was. I also had OVTI that made a bit more and actually made my target for the day by noon.

There was an interesting piece of historical data that suggested that every day-before- Labor Day weekend would be bullish in nature and Friday was no exception. We'll have to remember that for next year - can hardly wait.

I, as usual, was wrong about direction again and I am hoping that you remember rule 1 - nobody knows nothing including me. I'll keep making my case for the next day but my batting average is mighty poor and I might as well just guess. So here is what I'm gong to do. I'm going to present my "science" and my "prediction" then I'm going to flip a coin and if it's heads I'm calling the next day as up and if tails then it will be down.

First the science - the three sisters are all red which suggests a down day the next day but has not worked lately. In fact it hasn't worked 9 out of the last 10 days - in fact it seems to be a contrary indicator. I.e. last hour down - next day closes up - we'll watch this for awhile.

The Up/down ratio is 55% which suggests a weak Tuesday (note the careful choice of weasel words - weak). The VIX remains neutral which is perfect for what has been happening and the new 20 day high/low numbers are 1058 to 106. Still not a whole bunch out there to buy at least not with much confidence for a day trader.

Coin flip says - Heads! Going to be a bull's day on Tuesday.

We'll see.

Friday, September 01, 2006

Friday's Targets

There are always targets even in a market that is resting. Today I will be watching NZT, JNPR, KR, SGP and CHKP. All came up on my screen as having a momentum follow-through potential.

Just remember that the day will be over by noon.