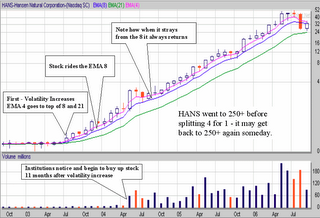
Then I was doing some investigation of stocks that seemed to start going up and never coming down such as HANS and a couple of others and I saw one thing very quickly - in the monthly charts of such stocks there is a decided change in the volume several months after the first indications of rise occurs.

That means that institutions have taken notice of the stock and from here on out the original buyers are on easy street. There is no easier way to make money than to own a stock that funds must have.
This got me thinking - is there a possibility on a shorter term to get some action out of volume and the EMA 8? So I designed a filter -
show stocks where close is between 15 and 25
and close > ema(90)
and close 3 days ago < ema(8)
and close > ema(8)
and average volume(90) > 2500000
and average volume(15) > 4500000
and draw ema(21)
and draw ema(8)
All I'm asking for is a stock that is crossing over the 8-period EMA and who's volume in the past 15 days is about twice its normal (90 day average) volume.
I back tested this filter and came up with some interesting statistics - in the period from August 9th to Friday the 22nd of September the filter was right 69% of the time to 29% wrong on a 5 day basis. I will take a filter that gives me a 7 to 3 advantage over 5 days every day in the week.
To validate the filter I removed the line and average volume(15) > 4500000 and reran the test in the same period. I achieved 60% to 40% results. But the more interesting component is that with the original filter the ROI was 57% and with the modified filter it was 4%. That is an incredible difference and is of significance.
The filtering software I use is from stockfetcher.com and I get nothing from an indorsement so I suggest you try them out. The charts as in most instances come from prophet.net which I still consider to be an excellent site. Again no indorsement comps but go try them anyway. The annotations on the charts are done by me in power point - there are other, perhaps better packages but I am most familiar with good old power point.

No comments:
Post a Comment