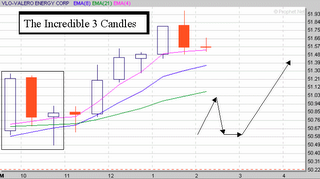
How it works is simple - a gap up followed by a decline or sideways move towards the 8-period EMA. This culminates in a hammer or (hammer-like) object or narrow range object (as shown in the figure both the 3rd and 4th candles are narrow-range objects) and then with a touch of the EMA 8 (5th bar in the figure) the price takes off.
The color of the first bar can be either red or white as only the gap-up is required with a subsequent move back to the 8-period EMA.
I normally use the 15 or 30 minute charts in my trading but I have seen this set-up on just about every time frame including weekly. The arrow pattern to the right in the figure shows the method clearly.


No comments:
Post a Comment