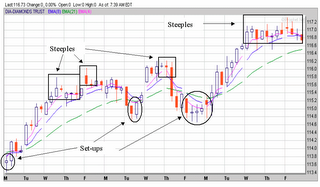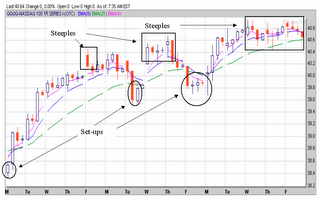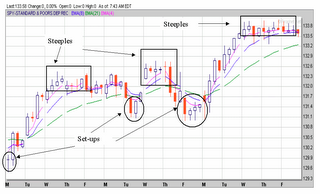


See what I call "steeples"? I call them that because they remind me of seeing towns in Europe from a distance and the only thing you saw at first were the church steeples long before the town itself became clear. I think the Japanese dubbed these castle tops or something like that.
These are generally topping indicators although they could also be indicating a consolidation. There are two other examples in the figures (from prophet.net - an excellent site) of the steeple formation. I've also noted a couple of set-ups for future reference.
I like the 2 hour charts as indicators because the period is long enough to make sense of the nonsense but still short enough to be useful for day trading. Now, of course, you don't have four 2-hour periods in a single trading day. So even though they are two hour charts the last one is actually only a half an hour. (Actually, in this case, a little longer because these instruments (SPY, QQQQ, and DIA) don't settle until 4:15 - but that's another story).

No comments:
Post a Comment