Showing posts with label HANS. Show all posts

Tuesday, May 15, 2007

The Double Cross

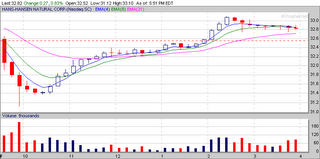
Last week I posted this chart and I said at that time it didn't look like it was a good thing -


Apparently it isn't

I think I'll wait for the next cross over.

Tuesday, May 08, 2007

Some Cross Overs

Here is a double cross -


I have no idea of the significance of this but I don't think it is good. HANS is an extremely volatile stock but this is ridiculous. I'm going to want to watch this for a bit to see which way it goes.

Here is HANS on a 3-day 30-minute version.


I'm showing you this because there is a cross over on the second day of this chart in the 2:30 bar. This crossover follows through into the next hour - but you know my rule - if you buy on the minute charts you should sell on the minute charts and not hold overnight. That would have been a very nice profit even so. You would have purchased at 38.40 and sold around 40.40 and 2 bucks in an hours nets out to a whole bunch annualized. I'm a purist with this indicator - the third bar of the second day is not a cross over because it didn't close above the averages. And if you made a mistake and took it as a cross over with your stop below the open of the that bar you would have been stopped out a bit later in the day.

Another chart I wanted to show you is RIMM.

There's no deep lesson here - just wanted to show you how the cross over works for expensive stocks too.

Still another is AAPL -


The cross over was back on 4/23 - a purchase on 4/24 would have reaped a nice profit over the next 10 days.

And here is MSFT -


The crossover came on 4/12. Note how the stock never dipped below that open and also note that the averages were in correct order (4 over 8 over 21) at this cross over. This too would have been a nice profit - at least as nice as they get with MSFT.

And finally the last of the three amigos, the final stooge - GOOG -


I'm showing GOOG to demonstrate the anti-cross - the reverse cross over. That occurred on 4/30. It was negated on 5/03 by a normal cross and that was negated by yet another anti-cross on 05/07. Stay tuned - which way do you think GOOG is going to go?

Tuesday, December 19, 2006

Tuesday Wraps

I’m still holding SYMC and WFC and both actually went up today. I managed to salvage most of my losses on ORCL this morning – I expected a small downside – not that steep drop but, as always with a mature company, the first drop is an overshoot and if you jump on board and double or triple up you can usually get out without losing your shirt – and that’s what I did. I wouldn’t do that for some no-name but I seldom play immature companies just for that reason – I really want to know how the trading community reacts to bad news or, as in this case, good news.

I jumped out on the rebound at .25 and only lost a 100 bucks in all. Considering I was a grand down at the start – not bad. I then took a solemn vow – I will never play ORCL again – this is the second time that it was traded out from under me for no good reason. It is now on my white board under the word “Never” along with 20 or 30 others that I will not play - mostly because they are empty pieces of junk that misbehave.

(start sermon)
Warning! Warning! Warning! If you try this on your next dump job and you lose don't blame me - it is not an approved method of trading. Never, never, never double up a losing position - Never! (end sermon)

In case you think I have forgotten my day trading skills I took a small position in MAMA off a new method that I have been testing. It seems to work but I’m going to tell you that the risk factor is high and you need to move quickly. I have found this to be an effective play in every time frame from 4 minutes through 15. Look at the chart below.


You can see what the new set-up is – if the first time increment encompasses all three of the EMA’s that I use then I buy it on the next open. I keep my mental stop at the EMA 21. Now I don’t know if this will work with other moving averages because I’m happy with it working with the three I use all the time. Interestingly, MAMA also had a classic set-up a bit later in the morning – but I was already in the trade.

If you don’t think this occurs very often – take a look here at WFC – also today.


And here is a counter-gap trade I wish I could have taken but I was back on the shopping detail this afternoon. I give you HANS.


Finally – I thought the markets had a good chance to go up today because the first hour PC ratio opened above yesterday’s first hour open and closed below yesterday’s first hour close. That was despite the fact that the FTSI 100 was down all day. As I mentioned yesterday - these are rules of thumb and not hard and fast "must be's".

Of course a lot of stocks did go up today – the up/down ratio is back at 45% but the new 20 day lows are still 200 more than the new 20 day highs and that is a good thing. The VIX is back at 5% below its 10 day moving average but the good news is that every major index we follow and GS finished the last hour with a strong red candle – there was a ton of selling going on. All of this leads me to believe that we will probably go up tomorrow. But as you know a good trader doesn’t care about the direction of the market because a good trader can make money regardless.

I’m giving Mr. Magic a pass for today since the market finished mixed which leaves him at 37 – 29. For tomorrow --- tails – bear in the air - - oh, who believes in magic anyway?

Thursday, December 07, 2006

Wrapping Thursday

Dumped AFFX this morning for a one cent gain. I knew right away that it was going to be a miserable day just based on the PC ratio. I watch it during the first hour of trading on the 60 minute charts. I want to see two things - where it opens and where it closes in that hour. If it opens below yesterday and closes below yesterday (first hour only) that is generally a good sign. Today it opened below yesterday and closed above. That means churn and burn. And that's what we had.

Still every day brings something new to look at and this is a beauty. A tweezer bottom with a one hour separation. I didn't see it until an hour after or I would have played it. I take the tweezer bottom seriously. Here is GM with its tweezer bottom on the 15 minute charts.


See where that long spike touched at 9:30 (and it's valid - I checked on the one-minute charts) is then reproduced by another touch at 10:45. That's the tweezer bottom. This is also a mini blow-off bottom and the buy point is on the close of the next candle. The exit is obvious around 1:30 to 2:15 or so. The lower highs in a row inform you of that. Always take the tweezer bottom seriously - it is a set-up alert.

I bought some BKUNA this morning figuring on an up day and the financials have been doing a fine job of leading lately but that trade collapsed. I'm was down a dime all day until 3 P.M. and am now down 30 cents thanks to the late day market fold so I'm holding it overnight at least. Another investment. I hate investments.

Of the several stocks that I said I would be watching, ATHR, SYMC, PTEN, and CRM, ATHR set up about 11 A.M. for a nice little run, the other three didn't. Because of the kind of day it was I passed the ATHR trade too. We'll try again tomorrow with LEND, AVCT, IM, NFLX, and SY. Who knows - a good day and we might get some.

We had a good day, I miscalled it but still no matter - we need a relaxation of the tension in the indices and today helped. The up/down ratio is now 34% and that is in oversold territory, the new 20 day highs came back under 600 to 554 and the new 20 lows increased by 70 to 259. The VIX is printing 9%+ over its 10 day average and SPY, QQQQ, IWM, and GS printed a red candle in the final hour of trading. DIA printed white. Regardless that is a very positive sign - I would have preferred for them all to be down in the final hour but we can't have everything can we. All of this together along with a good jobs number tomorrow spells a one day rally and then we can all take two weeks off until Christmas. I won't be taking off - but I will cut back on trading - maybe only 2 or 3 a week.

The magic coin is 34 and 26 having nailed today and I doubted it - what a maroon. For tomorrow, I can hardly wait, .... heads - bull market coming. Well - we agree, we'll see.

Tuesday, December 05, 2006

Tuesday Wrap Up

Dumped SYMC 5 minutes into the session and glad I was to do so. Picked up some AMD and got out a little ahead of commissions - it was up to a reasonable profit but I let it degrade into nearly a break even trade. A couple of old favorites such as HANS, GM, and AMR made some today - but I picked AMD as the trade of the day and that's the way of this game. You make your pick, you buy the assets, and you take what you get. But AMD is officially off my Christmas list.

This is nonsense - the market goes up for an hour and then degrades the rest of the day. I'll give you an idea - by 10:15 the DIA was up 25 cents to 123.22 - it closed at 123.35. Made 25 cents in 45 minutes and took another 6 hours to make an extra 13 cents. And it never really was much higher than that just another nickle. Can't make any money in this kind of environment. I'm considering going back to my old method which was strictly overnight - buy at 3:45 sell at 9:45. In that half hour you will make more money than at any other time in the market. So sayeth brother Brett (Dr. Steenbarger) and so sayeth Marlyn. But it takes real guts to hold overnight in this environment - so if you don't have the stones don't make the play.

Currently flat and happy - always be tomorrow. For tomorrow, although I think it is going to be a down day (but I think that almost every day and am wrong quite frequently) I will be watching BRCM, CTXS and AFFX. If the method I am researching pans out I will let you in on it tomorrow evening.

The up/down ratio prints 49% which is neutral as is the VIX. New 20 day highs did pull back some to 1028 and the new 20 day lows went ahead to 150. These changes are extremely small and meaningless. The three sisters, the ugly step sister and the proxy for the market of the 22nd century, GS, all finished the last hour in the white(green) which is a totally bogus signal as far as I'm concerned.

The problem remains - nothing to buy. To put it into a different perspective right now for stocks between 5 and 250 with an average 90 day volume greater than 500K there are 200 closing at the upper Bollinger Band and only 9 closing at the lower Bollinger Band. Tell me we aren't top heavy. Something has to give and, truthfully, we need a couple of weeks of solid declines. I hope we get them because only then will we be able to get back to making real money again on the day side. Besides the shortists need a break too.

Ol' magic coin is 33 and 25 having missed yet another one but persevering always it bravely soldiers on and for tomorrow says - heads - bull market. I think we can fade that.

Thursday, November 16, 2006

Thursday's Wrap

Bad storms today so I didn't get to play my usual round of golf - oh well. Made some money though - I played AMR and got a few cents out of it. Sold HANS on the bounce this morning and made some there - bought it back this evening and am going to do it again tomorrow morning. Seems that the only time it goes up is on the open. Sold off glass (GLW) too. I know I said I was going to keep it through the end of the month and I probably should have but I kept worrying about it and when you are worrying about a stock you should sell it. I worry about glass because of the flat screen glut on the market and eventually that is going to result in even more downside (I think) for that stock. If it pulls back again I might take another shot at it. Oh who am I kidding - the next dip and I'm in. As the man says - in a bull market you can only be wrong buying dips on the last one.

Tomorrow is probably going to be a very flat day because it is expiration day and lately the markets don't move on expiration day. But the externals are funny. The up down ratio took 1100 off and is printing 44% which is a huge down from yesterday. The new 20 day highs took 400 off and and the new 20 day lows added 50. The VIX stays overbought and now is more than 6% under its 10 day MA. The three sisters and the ugly step sister all finished the day printing a red candle in the last hour. But GS printed a strong white candle. If I only had a brain I would have put my entire account in GS a month ago and retired today. But I don't. Anyway yesterday I noted that all 5 of these issues finished with a red candle and this morning I went and looked and found out that that generally means a streak of higher highs coming as it doesn't happen that often. I think tomorrow is going up again as there doesn't seem to be anything that can bring it down, not news, not earnings, not anything.

Meanwhile the magic coin has now missed two in a row and that is not good. He's 30 and 18 and for tomorrow he says ... heads - back on the bully bandwagon.

Wednesday, November 15, 2006

Wrapping Wednesday

Market went up - what's new? Fed heads said no new interest rates. Ok - next? I actually lost $236 today. Took a late day position in HANS and it collapsed. But I turned it into an investment - you know the difference between and investment and a trade don't you? An investment is a trade that went South with no stop loss. I'll pitch it tomorrow on the morning bounce. I'm also hold a position in glass (GLW) which I plan to hold through the end of the month.

For tomorrow probably more of the same. As seen this morning we are starting into the Santa Claus rally period of the year. This is the time when all of the funds have to buy buy buy in order to make their numbers look swell and sweet to the hoi poloi so that more and more suckers - I mean - customers will come and buy their wares. Blah blah blah BS BS BS... anyway the three sisters, the ugly stepsister and the proxy for the 22nd century all finished the last hour in the red. I think that means we bounce tomorrow. The VIX continues to stay well below its 10 day average which is not good and the up/down ratio remains in neutral at 4154. Unfortunately 1249 stocks are now at new 20 day highs and only 150 (or half of yesterday's total) are at the low. The last time we had numbers like that the market went up the very next day and then went down for a couple of days. And the time before that and the time before that it did exactly the same thing. So I think the market is going to go up tomorrow and down on Friday - given Friday is expiration day it probably won't go anywhere.

Old magic coin is 30 and 17 having called a bear day for today. But for tomorrow he is saying ... tails again - more bear predicting.

Saturday, November 11, 2006

Two Hours to Tombstone

Ok – it wasn’t a movie – but it is an apt title for a process that looks at 2-hour charts to find bottoms. I’m going to show you three examples starting with one that contains a little dummy spot. After a period of relentless selling as shown on the 2-hour charts it is always a good idea to watch the opening hour or so the next day. If you see some movement in the opposite direction you probably have a winning trade developing even in the absence of any traditional set-ups. I call this selling exhaustion. Now some people would say well I could look at the RSI or other momentum indicator and see that to which I respond – maybe, maybe not. In fact of the three examples I will show here not a one of them printed an RSI below 25, at least not on the 2-hour charts.

First up – DHI. This is a homebuilder, and builders as you know have been beat up mercilessly over the past several months. However, every once in awhile a buyer or two steps in and starts to grab up shares. This usually happens right after some heavy selling. Here is what that looks like –


That little candlestick in the final position on Thursday is an actual “dummy spot”. When you see that the next move is generally up.

The next day on the 15-minute charts you can see that DHI gaps up a bit then loops down then takes off for the sky. Because of the gap up and the dummy spot on Thursday this would have been a good stock to watch for just this type of move on Friday.


I know Sally, I wish I'd had it too.

The next example is just relentless selling. No dummy spot, NR7 or any other indicator – GS was just being hammered down on Thursday. So on Friday what happens but a gap up and the rest is history. Again – in the face of relentless selling as seen on Thursday for this, a generally well-regarded stock, it pays to keep it on the watch list and if you see a change in direction, scoop some up.


The final example is one of my favorites, HANS. And this one is exactly the same as GS – relentless selling all the way into the close. The next day however there is a gap up and a very clear indicator (hammer) that the direction for the day is going to be up – up - up. I took a position off the confirmation second bar and held nearly to the top. Lucky me.


One way to make this work is to do some after hours or pre-market work and find a list of stocks that have gone down that day or preferably over several days. Then view them on two hour charts and see how they did it. If they were stone cold drops they might be plays but are risky. But if they show relentless selling over the course of the day you might want to watch them the next day.

Once more props to prophet.net - the excellent charting service that I use. I don't get anything from them so go on over there and take a look. You might like their site.

Monday, November 06, 2006

Monday Wraps It Up

Wow. What a day - I missed most of it. Had an appointment this morning and by the time I got back it was over. Everything was at its high of the day and nothing was coming off the floor - including HANS which gapped down severely this A.M. on an excuse. The excuse? That options backdating thing that's been going on. So far HANS is the only stock affected in this manner (severe drop) and they are only going to be investigating - no one has said that they actually had a problem. Thus it is an excuse not a reason. The institutions holding HANS wanted a reason to get out. How do I know? Almost double volume. Then there was no buying once it found a floor. Might be I've lost another momo stock and have to go fishing again. We'll see.

For tomorrow --- the three sisters all finished the last hour in the red as did the ugly step sister (IWM) as did the 22nd century proxy for the market - GS. Unfortunately the VIX didn't move, the new 20 day highs only increased by 17 and the new 20 day lows increased to over 600. The up/down ratio remains in neutral. You would think in such a booming economy that stocks would generally go up - well only some of them did.

This is truly a mixed message but I'm going out on a limb and suggest that tomorrow is going to be a down day because it is needed. I might be wrong but as I'm fond of saying - it doesn't matter because I'm going to play golf.

The magic coin is 26 and 14 because it called for a bear day and it obviously wasn't. For tomorrow the coin says ... heads - bull run again.

See you tomorrow after the market closes.

Friday, November 03, 2006

Fraday Warp Up

Crazy day - but I kind of predicted it this morning so you can forget what the bobbleheads on bubblevision said about oil and the blah blah blah - fact is the market needed a rest. Now IWM didn't but that's another story which we will cover later this weekend.

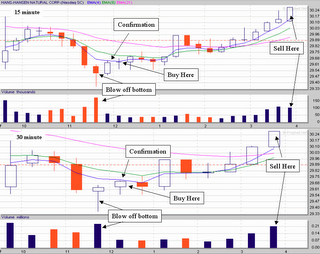
I made money today - I played HANS. What, you sputter, again?!? Aye, says I, I again played HANS. Why do I play the same stocks day after day? Because they set up for a play and I know how other traders will be acting given that set up. I know because I observe - you can too. Here is a picture showing HANS in both 15 and 30 minute charting modes. Note the similarities.


I'm showing it to you this way because you need to know what a blow-out bottom looks like and it doesn't necessarily have to be a white candle - it can be red. It just needs a lot of volume (one of the few times I will use volume to inform my trades) and it is a hammer-like critter regardless of the time frame. I.E. a long tail or lower shadow which is how it is referred to in polite company.

Where it says "buy here" I did and where it says "sell here" I did also. I was 6 cents early on the sale but that's ok - I picked up 48 cents overall.

For Monday we are looking at a recovery. Again the market never goes straight down - it moves in fits and starts. The interesting thing is the up/down ratio went up today to 45% or into the neutral territory. We added to the 20 day new highs brining it to 423 and we subtracted from the 20 day new lows printing 591. That can only mean one thing - what you didn't see was a market struggling to right itself. The SPY finished in the red but the Q's finished strong as did DIA. The VIX remained in neutral. Prognosis - Monday is an up day. I'll probably play HANS again.

Mr. Magic missed today making him 26 and 13. For Monday he says tails - bear in the air - Sir, I disagree!

See you later this weekend with some more tripe and trivia.

Thursday, November 02, 2006

Wrapping Thursday

Missed most of today - thank God - but did play AMD for a brief time this morning - lost a dime and HANS for an hour or so and made 50 cents. I played AMD off a two white candle formation and it went one more increment and I thought, based on shaky price action, that I should sell it then but didn't - consequently the dime loss. HANS I played off the white hammer in the first 15 minute candle. The next candle was a red spinning top which generally means wait a minute I'm thinking and this was then followed by a white candle where I took the trade. I was out about the high of the day but I didn't know that until this afternoon when I returned to the office.

Tomorrow is shaping up to be an up day - the three sisters all finished with white candles in the last hour and the VIX is back in neutral territory. The up/down ratio still stays bullish at 36% and the new 20 day highs lost some more to 333 but the new 20 day lows put on over a 100 to 715. The last time the new 20 day lows were over 700 was over 60 days and 10 SPY points ago. Another thing is that the end of the month checks will have been in the process for over 3 days which means that they are now cleared for investment purposes and the funds can start buying everything in sight.

Magic coin is 26 and 12 having nailed today even though it wasn't so much a bear day as a pause. But I'll give him his due and put another in his win column. For tomorrow he says - heads - the bull is back - I agree.

I'll be back tomorrow morning with another screen shot of the IWM and friends and we will see what Marlyn's Curve thinks about all of this.

Wednesday, November 01, 2006

Wednesday Wraps Dallas

As I wrote this morning - Wednesday morning coming down. I played HANS and made some on it off a dip caused by Cramer bless his heart. He isn't the sharpest tool in the chest but he sure is entertaining.

It was an old fashioned "what is this stock doing way down here" buy and it worked out. The morning of course was a whole lot different from the afternoon which turned out to be a shortists wet dream.

Tomorrow is simple enough up - up - and away. Why? The up/down ratio is 29%; for the first time in over 29 days the new 20 day lows out number the new 20 day highs (585 to 357); and the VIX is actually 5% greater than its 10 day moving average. All three sisters finished in the white in the last hour of trading. There is nothing more to say - there are stocks to buy and the money is going to be coming in from the IRA and 401K crowd.

Mr. Majestic is 25 and 12 having nailed today perfectly and for tomorrow ... tails again - I can not agree.

Sunday, October 22, 2006

Trade Ideas

Three great shots on Friday - RHAT and CTXS off the third candle on the 15-minute charts and HANS off the 6th candle on the 10-minute chart. I keep records of all my trades (scans of the charts with notes on them) and I note that I make most of my gains on these "mini-dips."

This is the HANS chart - see the "dummy spot" at the 6th stick? This is followed by a confirmation in the next stick and that is a wonderful place to buy. Especially if it is a stock you trust to go up. The reason why I trust it to go up is because so many other traders are gaming the same spots. Consequently we all see the same thing and we all make the same buying action.


I also watch for high volatility stocks that have dropped as a result of a bad earnings report. For example CTXS crashed and burned on Thursday and now it could oscillate up and down for several days to weeks and might prove to be like a fruit tree in a garden and provide numerous opportunities to harvest profits on a daily basis. SNDK is another one in that genre - took a 20% haircut on Friday - I'm keeping it on a watch list and am going to try to harvest a number of opportunities from it. HANS has also been a good “earner” for me in that it is up and down like a yo-yo. In the last 15 days there were 10 opportunities to take a day trade long in HANS.

You don't need a crystal ball just an imagination and a good set of charting software. I use prophet.net and find it excellent - you can try it out for free you just won't get real-time charting capabilities but you will get real-time scans. I get nothing from this endorsement so go ahead and give it a looksee.