If you take the time to analyze the indicators that you use you will see that they are not telling you anything that you don't already know. The reason I use the exponential averages however is that I have found them to be wonderful predictors of what other traders will probably do. Only "probably" because we can't ever know for sure what the other several thousand people looking at this particular stock are going to do - or can we?
Friday 10 3 2006 - a particularly nasty day for longs and shorts believe it or not. Just because a market is going down doesn't mean that the stock you are in is. In fact it might have blown all of its downward momentum early and is now looking for a bid.
Anyway here is what you should be watching - the Q's - and if you happened to have had them up on a 4 minute chart with the 4, 8 and 21 EMA's here is what you would have seen...

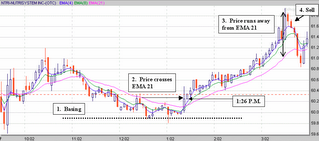
The Q's were basing begining about 11:20 or so. Now you wouldn't have known that until around 1 P.M. but seeing this pattern of prices with the 4 and the 8 EMA's intertwining tells you that traders are buying. Not just that selling has stopped but that buying is taking place with any selling that is going on. Just before 1 P.M. we had another attempt at a blow out bottom. I say another attempt because between 11:20 and then there were at least 3 others. Could be a false alarm - watch for awhile. At 1:22 or there abouts the price rises out of the consolidation basing area and crosses the 21 EMA. That is a clear cut signal that more buying is happening than selling. Quickly you switch to your watch lists and find --- NTRI --- and look what else you see...

A couple of attempts to break out and then a tall white candle crossing the 21 EMA. See how the 4 and 8 EMA's had been intertwining - this suggests that someone was buying every offer and then some. The break out came 2 minutes after the Q's broke out - isn't that amazing. Now all we have to do is watch for a clear cut exit that came a little before COB. There was a blow out top - this is recognized by the fact that the price is running away from the 21 EMA. When that happens the 21 EMA acts as an attractor and pulls it back again. I would wait for two elements of confirmation which came quickly in the next 8 minutes and then sell - sell - sell.
And that is how you make a buck and change on a bad day without using technical analysis. Notice how I never mentioned ROC, MACD or Bollinger Bands - not once.
Oh one more thing - why do I use "4-minute charts"? Because most traders use 5- minute charts and I want to be one minute ahead of them. (That's a 20% advantage).

No comments:
Post a Comment