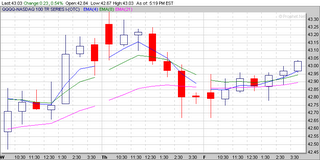
The NR7 is simply the narrowest range bar in the last seven regardless of the frequency being used. Whenever you come across the NR7 be careful. The direction of movement is probably going to change. Now the really observant reader will have already seen that there are actually two NR7 bars on this picture. One at the end of the day on Thursday and one at the top of the range on Thursday. You see a narrow range bar is the narrowest of the last seven and the last seven can include a narrow range 7 bar. Don't think about it for too long - your head will explode - just appreciate the power of the NR7. As an extra credit question can anyone guess why it is so powerful?

That's right - the buying or selling is drying up and the market is resting and preparing for a new move in a different direction. Good Ferris - you can stay after class and clean the erasers. The rest of you - dismissed.

No comments:
Post a Comment