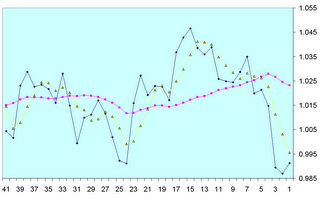
Above is a picture of IWM, the black line is the normalized returns over the period selected, the yellow line is the 4 period average of the black line and the red line is the 20 period average of the black line. You don't have to be a rocket scientist to be able to figure out why IWM closed up on Friday - it was getting too far away from its 20 day average. Now the only problem with that statement is - how far is too far? Well we really don't know - all we can really say is that given 2% difference between averages price is going to react - most of the time. And you can take that to the bank.

No comments:
Post a Comment