So when people start talking about the 200 period this or the 200 period that tell them to take 90 and get real.
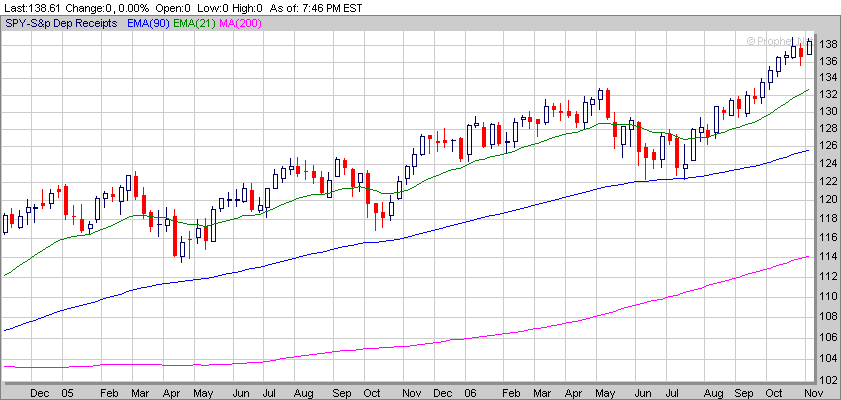
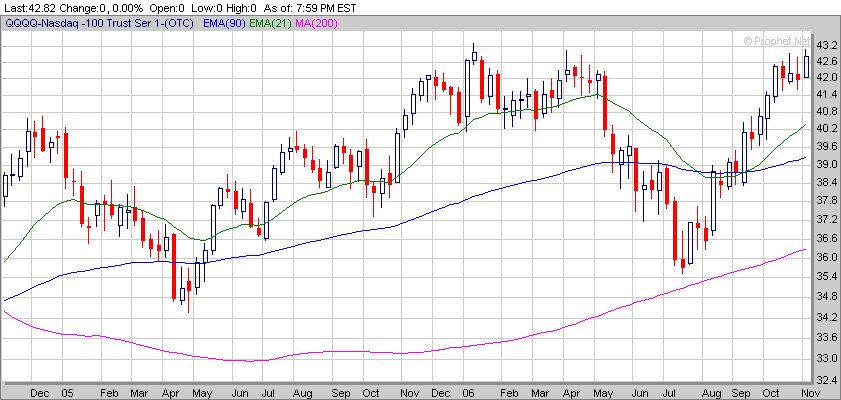
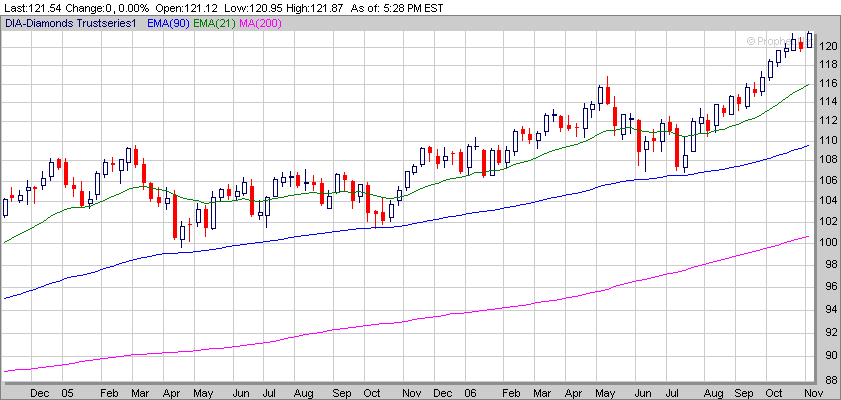
The other average shown (in green) is the 21 period EMA. I use that average as a gauge to determine whether the stock will be a candidate for reversion to the mean. Whenever it gets too far away from the 90 it seems to want to scurry back. Of course, "too far" is a nebulous term that can mean just about anything. If you watch the stocks for awhile you can pretty much judge what "too far" is just by eye.

No comments:
Post a Comment