Ok – it wasn’t a movie – but it is an apt title for a process that looks at 2-hour charts to find bottoms. I’m going to show you three examples starting with one that contains a little dummy spot. After a period of relentless selling as shown on the 2-hour charts it is always a good idea to watch the opening hour or so the next day. If you see some movement in the opposite direction you probably have a winning trade developing even in the absence of any traditional set-ups. I call this selling exhaustion. Now some people would say well I could look at the RSI or other momentum indicator and see that to which I respond – maybe, maybe not. In fact of the three examples I will show here not a one of them printed an RSI below 25, at least not on the 2-hour charts.
First up – DHI. This is a homebuilder, and builders as you know have been beat up mercilessly over the past several months. However, every once in awhile a buyer or two steps in and starts to grab up shares. This usually happens right after some heavy selling. Here is what that looks like –
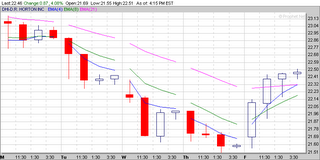
That little candlestick in the final position on Thursday is an actual “dummy spot”. When you see that the next move is generally up.
The next day on the 15-minute charts you can see that DHI gaps up a bit then loops down then takes off for the sky. Because of the gap up and the dummy spot on Thursday this would have been a good stock to watch for just this type of move on Friday.

I know Sally, I wish I'd had it too.
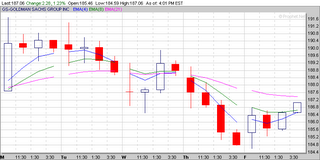
The next example is just relentless selling. No dummy spot, NR7 or any other indicator – GS was just being hammered down on Thursday. So on Friday what happens but a gap up and the rest is history. Again – in the face of relentless selling as seen on Thursday for this, a generally well-regarded stock, it pays to keep it on the watch list and if you see a change in direction, scoop some up.
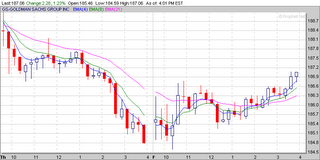
The final example is one of my favorites, HANS. And this one is exactly the same as GS – relentless selling all the way into the close. The next day however there is a gap up and a very clear indicator (hammer) that the direction for the day is going to be up – up - up. I took a position off the confirmation second bar and held nearly to the top. Lucky me.


One way to make this work is to do some after hours or pre-market work and find a list of stocks that have gone down that day or preferably over several days. Then view them on two hour charts and see how they did it. If they were stone cold drops they might be plays but are risky. But if they show relentless selling over the course of the day you might want to watch them the next day.
Once more props to prophet.net - the excellent charting service that I use. I don't get anything from them so go on over there and take a look. You might like their site.