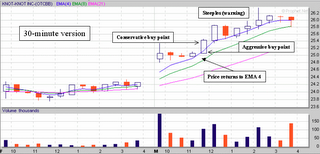
You can see that I use the EMA's 4, 8 and 21 - I used to use the simple moving averages but I have found that the exponentials suit my trading style and so I prefer them. Note that this is a preference only - others prefer the SMA - to each his own. In this set up there is a gap-up of indeterminant range. The next one to three candles slide sideways until the price returns to the 4 EMA. From there it is just a waiting game. I have put two entry points on the chart - an aggressive one which is the one I usually take and a more conservative one - again to each his own. Later in the day you start seeing steeples and, with the village in sight, it is time to think about ending this trip. That should come with the second to last candle if not the last.
Interestingly enough on 30-minute charts there is yet one more entry opportunity right after the large red candle but I would consider that to be a dangerous place because it is afternoon. Some people play then - I don't normally start trades in the afternoon.
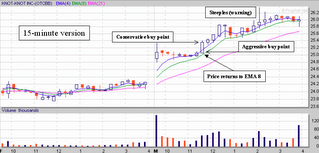
Because we don't mess around in this Blog here is the same trade except on a 15-minute basis.

This one is actually showing you a dummy spot (that little red Doji in the 4th candle. If the next candle was a substantial hammer it would have been the entry point but it wasn't so we continue waiting for the set-up to develop.
Basically the entry and exit points are about the same but there is one critical difference between 15-minute and 30-minute set-ups - see it? That's right - on the 15-minute chart the price should return inside the 4 EMA and almost or actually touch the 8 EMA. Again there are two normal buy points - one conservative and one aggressive. And once again when you start seeing the steeples you are approaching the village and it is time to start thinking about ending the journey.
Once more there is a tertiary entry point around 1 P.M. right after that red Doji (dummy spot) that hit the 8 EMA. I consider this to be a little less dangerous entry than the one shown on 30-minute charts but only because of the fact that it is a Doji, it is rebounding from the 8 EMA, and it is followed by a hammer.
It is important to note that while set ups appear equivalent across time frames there is usually a little something that is different. For example the difference between the 4 and 8 EMA's. Now you won't always see that effect but I like to see it because it raises the probability of the trade being a success in my process.
Again all charts from prophet.net with annotations done in power point (thanks Mr. Softee) and based on set ups that I first learned from the King - Trader X. He probably wouldn't recognize these but everyone has their own methods that keeps them in the comfort zone.

No comments:
Post a Comment