Many times when you find a trade from a 2-hour chart it can be used for several days running thus it makes a good swing trade finder as well. The two hours go like this 9:30 – 11:30, 11:30 – 1:30, 1:30 – 3:30 and 3:30 to 4. What? - I hear you scream – yes Virginia there are only three 2-hour periods in any given day and the last “2-hour” period is only a half-hour. That’s why the last period is of so much importance – it is the time that is used for book squaring.
If relentless selling continues during that final half-hour of the day you can be pretty sure you are going to have an up day the next day. That’s because the first time the stock shows any change all of those late sellers are going to come flying back. Those late sellers are what we in the business call “suckerfish.” They are either getting out of losing positions or making late day short sales hoping to scalp an overnight gap down. In either instance they are going to be eager to reacquire if they see any movement at all in an upward direction. This is an automatic profit if you are in quick enough.
However, in the other instance where there is evidence that the selling is drying up, I.E. either a dummy spot or NR7 there is a good possibility that the stock will not only go up the next day but also continue to go up over several days. This effect is enhanced if the market at large is also going up during the same period.
Here then are five charts that you could possibly use as models for future swing trade set-ups.
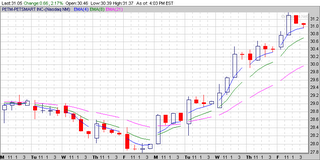
PETM actually bottomed in the second 2-hour trading period, which is indicated by that very clear dummy spot, followed by the doji, which is then followed by confirmation.

RIO also has a dummy spot this one in the third 2-hour period which is then followed by some suckerfish action which is then scared p-less by the next day’s gap up.

ARD, despite what you might think, only really has the one entry which is the NR7 shown in the first 2-hour period after the relentless selling that went on in the third day in the picture. Remember we always wait for a confirmation before committing funds and there was no confirmation until the candle following that NR7.

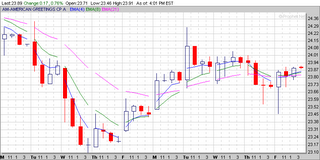
AM throws off a dummy spot with a confirmation (third and fourth days pictured) While some selling goes on if you have a stop it should be below the dummy spot on the third day and that is never taken out. The AM trade isn’t finished yet although a lot of folks would have gotten out after that steeple on Tuesday’s first 2-hour period.

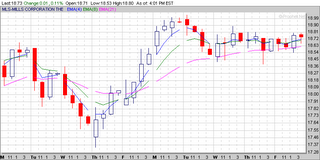
MLS, not only is this a builder but it is a builder of malls and the worst kind of those, mega-malls. Again there was relentless selling including some suckerfish selling on the third day. Imagine the panic when the stock turned around the next day. Obviously a good place to buy since a lot of shorts had to cover. Note the obvious exit at the peak dummy spot on Monday. Next day confirms and you are out.

And that's how it is done. Again you always trade at your own risk - what I show here are examples only and are not to be taken as guarantees.

1 comment:
bape clothing
air jordan
off white
goyard handbags
jordan shoes
Post a Comment