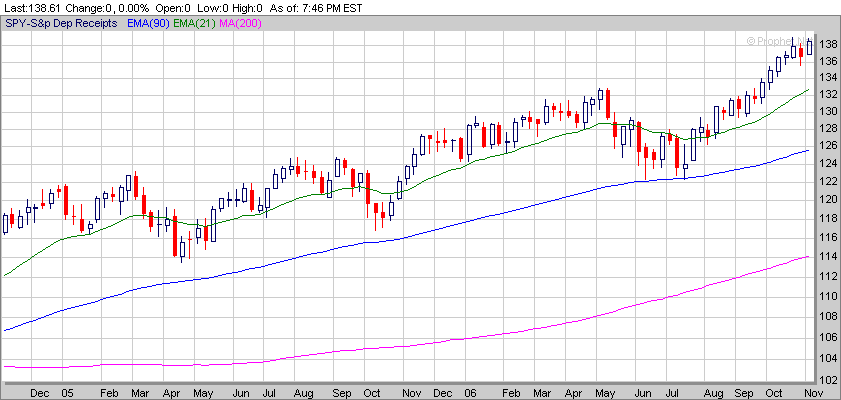
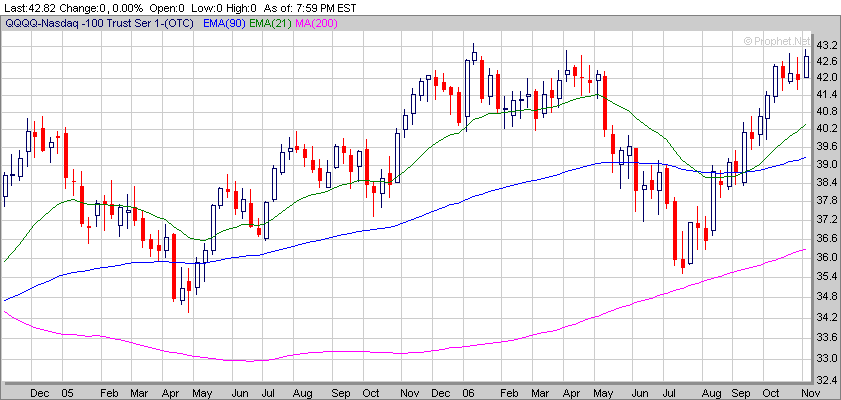
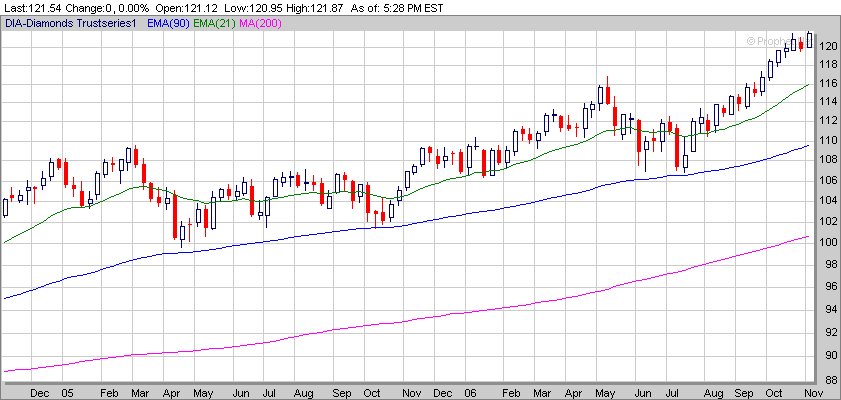
Futures are up but that is transitory at best. Everything I look at (and I look at things you not only don't look at, you probably have no idea they exist) says the market is going to rest for awhile. Now that doesn't mean much to those of us who are in and out in a single session - but for long term holders it can be problematic. Imagine - still paying those mutual fund fees even when the market is collapsing. In the name of "management". Give me a chance at that gig - I wouldn't mind making six figures or better a year win, lose or draw.
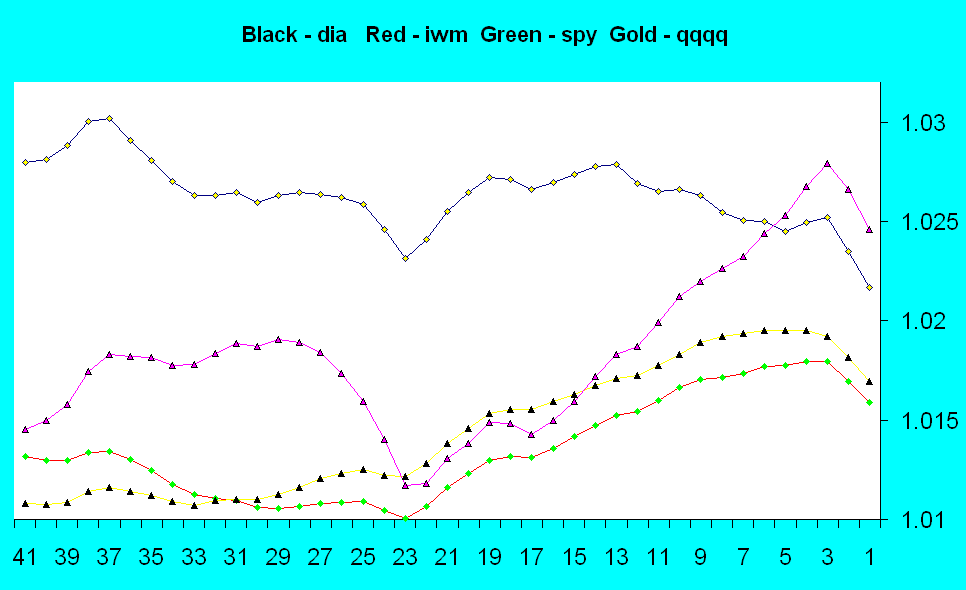
Here's a familiar figure - one I've been showing all week -

I didn't bother to annotate it - if you don't know what the lines represent from the chart title then look back a couple of days. Also yesterday is at "1".
Note how the dive continues. But also note the dynamics. The Q's turned over first then came the DIA and then the IWM and SPY both took head first dives. But the IWM is the more severe of the two - I guess holding even as many as 2000 stocks is not enough diversification in a melt-down.
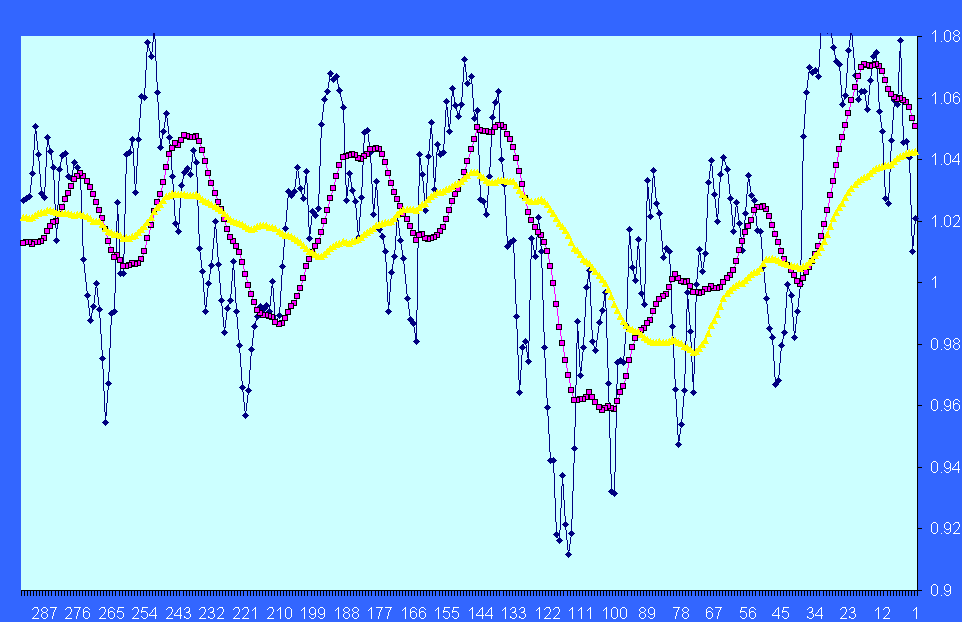
Now here's something a little different. I've mentioned a couple of times lately how Goldman Sachs (GS) is the new proxy for the market - I.E. as GS goes goes the market - here is a chart of GS over the past year and a half.

What you are seeing here are the returns (narrow black chaotic line) on a daily basis - the 20 day average of the returns (red line) and the 50 day average of the returns (gold line). Note how GS started rolling over almost 6 weeks ago. It's bounced around quite a bit in the interim but whenever you start getting that congestion at the top of the bottom in the 20 day average you generally get a trend change.
Now, Ferris, for extra credit - what else happened in the past 6 weeks? That's right - the Dow Jones Industrial Average made a new all time record close - several times. Wowsers - wowsers was that ever meaningful!!! (three baseball bats worth of wowsers). If you guessed
probably not you are probably correct.
The best part of Marlyn's Curve is this - when both averages are inclining in the same direction - that is the imutable direction of the market. Note carefully that the gold line is about to join the red line on the descent.
I use this indicator in my trading to inform me when it might be safe to hold some losing long overnight (both averages ascending). I use the indicator in descent to inform me when to go on vacation because pickings will be slim for awhile - no sense fighting the trend. But most of the time the two averages are in opposition to one another. The best time to take longs is when the 20 day is ascending and the best time to play shorts is when the 20 day is descending. The past several weeks have not been a disappointment in this regard. Because although the averages were making new highs many stocks were starting to make new lows.
We will revisit this particular stock again, maybe this weekend, when we discuss reversion to the mean. There are some things you might want to know about that.