Very few older books even mentioned exponential moving averages and then it was an oh-by-the-way throwaway line. In fact I didn't use them much myself until I read Martin Schwartz's book, "Pit Bull". I don't know if you know about Marty but you should - he is a champion trader - and not self-certified like Jimmy Crack Corn Pone. If you haven't read his book - what are you waiting for? Marty is a bit of an arrogant boy-o (like me) but the book is worth reading.
I can't find the exact quote right now but Marty used exponential moving averages in his trading. And he made it seem like they were the right way to do things. (He also used Landry's "T" but that might be a subject for a future post). After I read his book back in 2000 I started seeing the EMA for its value to my trading.
Here is the DIA in a 5-year weekly view with a 90-period EMA and a 200-period SMA - which moving average best reflects the support levels of the DIA? (Hint - the EMA is the "blue" one).

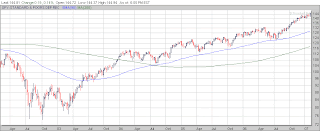
To drive home the lesson - here is the SPY 5-year weekly view with a 90-period EMA and a 200-period SMA - which moving average best reflects the support levels of the SPY?

Tell me which moving average would the SPY fall through first if it were going down? Which one would it go through first if it were going up? Don't you want to be first?
Of course, you say, but what about the 50-period SMA? Here is the SPY with the 50-period SMA? Which average best describes resistance?

But there is another point I'd like to make regarding these two averages. I'd like you to look at this charts very closely and you will notice that back in '03 it ran well away from the SMA 50 but only came back in when it got away from the EMA 90. You can see that between Jul and the following April the 50 was rising to catch up with the price and in fact crossed over the EMA 90 in its effort. But the market turned down in early 04 even though the 50 was rising to meet it. I think, just based on the geometry of the chart, price was seeking the EMA 90.
I personally believe that people who ignore the EMA and use MA's leave money on the table. But it is your money and your choice - try them both and find the best and most trusted method for you.
I use the EMA 90, EMA 21, EMA 8, and EMA 8 in my trading in all time frames. I seldom even look at an SMA except for testing purposes. If I find a good filter using SMA I guarantee I will publish it.

3 comments:
I'm convinced.
Very tricky stuff.
pop over here dolabuy gucci hop over to this web-site Balenciaga Dolabuy page high quality replica bags
Post a Comment