Tuesday, October 31, 2006
Tuesday Wraps Fish
Note that when I follow my process (engineered trading) I don't lost lots of money - I may not make a lot some days but today was better than a loss anytime and I had a large position almost all day.
My post this morning is more meaningful (to me now even if it isn't to you) because I once again visited that trading chat room and was called "stupid" (in an indirect manner) because I prefer the long side of trading. The young moron who called me stupid had no skin of his own in the game which is why I have no compunction about calling him a "moron" but I didn't do that to his face (so to speak) because my rule is wait 24 hours and if it still matters tomorrow - I'll give him a piece of my mind. Trust me - he's going to get it.
Speaking of tomorrow - the up/down ratio remains neutral at 45%, the three sisters finished the last hour in the green and the VIX hardly budged. The new 20 day highs actually added some today (about 50) to 621 and added about 25 new lows to 275. That is goodness in that new lows give people things to buy.
As you know the only reason the market goes up is because there are things to buy and the only reason it comes down is that there is nothing left to buy. That is known as supply and demand - or at a certain price things will be bought and at another certain price they will be sold and generally those prices are low and high respectively.
I'm calling it a draw for the magic coin again so it remains at 24 and 12 and for tomorrow it says --- tails - bear in the air.
Good Tuesday Morning
But I have had to cut them back again - amazing how I keep cutting back over and over again. The fact is you can read BLOGs all day long and not get anything else done and at the end of the day feel as if you accomplished something but in reality all you did was read other people's BLOGs all day long and you probably don't even have a new idea to show for the effort.
Worse yet you might even be tempted to comment on what someone has written and next thing you know you are involved in a discussion with people whom you probably wouldn't give the time of day to if you met them on the street - well maybe you would do that but you certainly wouldn't give them financial advice nor take any from them.
Even worse than that is you might get involved in a trading chat room and wind up giving buy and sell advice on individual stocks to people who don't know you from Adam's house cat and worse yet they might even take your advice - even though sometimes it is pretty good you must always remember the first rule - nay I say unto you the PRIME DIRECTIVE - nobody knows nothing - including me!!!!
Not that I've caused any harm - yet - and that is a powerful word "yet" so I'm quitting getting involved in other folks BLOGs while I'm still ahead. That will give me more time for my own and maybe I can keep it fun and new and current.
See you later with news of the day.
Monday, October 30, 2006
Monday Wraps It
Then I bought some VRSN - this time off a hammer formation with a confirmation - look at the 12:30 candle and the 1 P.M. candle - that's where I bought it - I sold at the 2:45 candle.
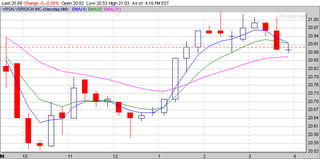
Along the way I also bought RIO on a hammer formation but this one failed and I sold it at a 2 cent loss. Almost a break even trade.
All in all what an absolute crap day - 5 stocks 2 wins, one even, one loss (big one) and a holder. Hopefully the holder, SAI, will bounce enough tomorrow to get me even with the board.
In the midst of all of this crap trading I missed AMR and CTXS both of which set up nicely right out of the box and would have provided a healthy return. Oh me oh my - that's what happens when you start looking around for something new. You never know what you got till it's gone - you take paradise ... oh never mind.
For tomorrow I envision an up day - the up/down ratio remains in neutral (45%) and the VIX is also neutral. Two of the three sisters finished in the red but barely and the Q's finished strong. The 20 day new highs added a 100 but the lows only dropped 14. These are all good things for an up day tomorrow - at least tomorrow morning which is all I really care about.
I'm going to leave the coin with 24 and 12 since today was mixed and there is no way the coin can land on the edge - for tomorrow - heads - bull run coming.
Sunday, October 29, 2006
Hammer Entry - More Examples
ACI – first the energy sector was going up on this date so ACI was a natural for a play – the coal industry normally participates in the energy rallies. This is a standard white-hammer indicator (1). The next bar in the sequence opened at the close of the white hammer and then descended. It then rallied (2) and the buy point is when the price exceeds the high of the hammer (3). The sell point is at 4 where we see two lower highs.
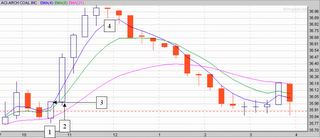
RIO – a steel play the hammer is only hammer-like but close enough to serve as an entry indicator. The next bar in the sequence opened at the high of the hammer and then descended. It then rallied (2) and the buy point is when the price exceeds the close of the white hammer (3). The sell point is at 4 where we see a twin-peaks top (two highs exactly the same). The twin peaks is generally a good exit point.

ATHR – a telecom play has three hammers in a row and any one of them could have been used for an entry indicator because we will only enter when we get the confirmation where the price exceeds the close of the red hammer. Therefore using the 4th bar as the entry point we wait until a price exceeds that close (3). The exit is based on the “steeples” we see developing at 4 and confirmed at 5. Sometimes when the price gets away from the 8 period EMA it begins to walk sideways back to it. That’s what we might be seeing in bars 10 and 11. But the confirmation comes at 5 and that says – exit now.

PETM - an Internet play – this is a good one in that it does this often. This is a red hammer entry (1) at bar 6. The next bar in the sequence opened at the close of the red hammer and then descended. It then rallied (2) and the buy point is when the price exceeds the close of the red hammer (3). The exit (4) is the large steeple at bar 12. I generally use this upside down hammer (or hanging man) as my clue to exit. Note that the 11th bar on ATHR is also a hanging man.
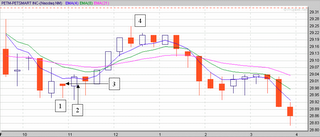
All of the charts come from prophet.net - an excellent site.
Saturday, October 28, 2006
Hammer Entry


Note that the entry point is always higher than the hammer. I use that as a confirmation point and set my buy stop a couple of cents higher the the top of the hammer. It probably isn't necessary but I like the comfort of the confirmation and am willing to give up a couple of cents for it. If I set a stop it would be at the bottom of the hammer body or 10 cents whichever is greater.
Friday, October 27, 2006
Friday Wraps
Monday should shape up to be a fine day - end of the month of October is traditionally the start of the up season and I think today was just the prelude to that event. Anyway the up/down ratio is a torrid 30%, the new highs shaved about a thousand to 472 and the new lows hardly moved but went all the way up to 281. These are great numbers. It means the pressure is off but the rally is still intact. The three sisters finished in the white and the VIX remained neutral - pulling back a little more towards its 10 day MA.
The coin, magic my butt, is now 24 and 12 having blown an obvious lay-up today but for Monday it says ... heads - bull market comes - I believe it.
I'll be back later this weekend with some more charts for your viewing pleasure.
Thursday Later Than Usual Wrap
Took a position in AMR (again, yet again) and it proved profitable but also served to show yet another nifty concept regarding a stock's price - that moves are done in waves. Take a look at this daily 15-minute chart.
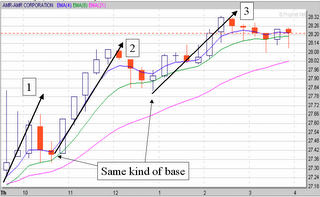
You will see this pattern repeated over and over again in both directions. It's why we traders sometimes are crossed up because we are waiting for the third wave and the bottom falls out instead. But if you watch for setups you can see that you can use this wave method to find afternoon plays that are sometimes better than those in the morning.
Friday should be a down day - The up/down ratio has crossed the divide and now sits at 64% while new 20 day highs are at 1422 and lows are printing 159. There is nothing left to buy and this market has to be bone weary and tired regardless of all the good earnings news. And that isn't really that good anyway.
The VIX remains neutral although I don't know how but the fact is a low VIX is not as important as a high one. The three sisters either finished the last hour red or as a topping doji. The three major indices all finished with topping doji as well. She's goin' down I tells ya she's goin' down ... which is not a good thing.
Mr. Magestic ("magestic - majestic + magic" - get it) never mind - the smartass coin is now 24 and 11 having nailed Thursday and for tomorrow says ---- heads - bull market. I'm not going against the coin.
Wednesday, October 25, 2006
Wednesday - Fed Wrap Up
I had a position in GLW again today - made about 30 cents net but at least I made a profit - I can go back to trading again tomorrow with my head up and my 30 cents jingling in my pocket and feel as if I might even know what I'm doing. I don't which is why I have rule 1 - nobody knows nothing - including me.
For tomorrow more of the same - the up/down ratio remains in neutral and the new 20 day highs are running away from the new 20 day lows, 1037 to 220, which is beginning to sound like a broken record and about as appealing to the ear - the VIX remains in neutral territory and the 3 sisters all finished strongly in the last hour in the green
Mr. Magic is 23 and 11 having missed today - for tomorrow he says - heads - bull market time.
Probably
Small Cap Large Cap
As you can see in the figure(using the powerful comparator - the proprietary Marlyn's Curve) while the Dow returns are collapsing the small caps as represented by the IWM are actually rising.
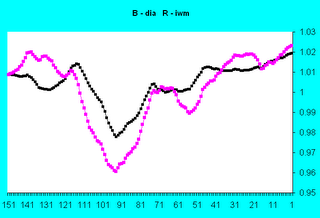
In the last 20 days during the time of the vaunted Dow 30 record-making run the small caps have been going up while the Dow 30 has been rolling over as a prelude to going down.
For those of you coming late to the party - I use returns as a basis of comparison - not absolute value. Absolute value is useless because you can only spend returns and stay healthy. (If you eat your seed you die).
Update - 10 26 2006 - I didn't like the looks of the diagram and it turned out that I used the wrong one. This one is correct and shows the correct relationship between the DIA and the IWM.
GLW and Stop Sweeping
Easy money for the book and one more reason to only use electronic trading as offered by NASDAQ.
The New York Stock Exchange is so 1900's - don't you think?
Tuesday, October 24, 2006
Tuesday Wrap Up
GLW has bottomed and tomorrow it will go to the sky - I'll be there - and this time no ill timed stop sweep will catch me out.
Tomorrow we can expect more of the same - except that earnings this evening are coming in strong and righteous and I think we might even go higher - the three sisters all finished the last hour in the green - the up/down ratio is neutral at 42% the new 20 day lows actually added to their anemic total and are up to 272 while the highs are backing down to 731. The VIX came back into neutral territory and the magic coin - 23 and 10 having picked today correctly - says for tomorrow - tails - the bear is about.
We'll see.
Monday, October 23, 2006
Manday Wraps Cheese
Tomorrow more of this crap market continues. Up/down ratio sits at 46% or neutral, VIX is more than 5% below 10 day MA which is bordering on who cares - there were 724 new 20 day highs and 222 new 20 day lows. Again much ado about nothing. Both the DIA and the SPY finished the last hour in the red but the Q's were white. Eventually we have to go down - it just is - I'm seriously thinking about staying on the sidelines until that happens.
I won't - but I'm thinking about it.
The magic coin, and this is getting boring, got another one right for 22 and 10 - and for tomorrow - heads - bull market coming once more. Who am I to disagree.
Sunday, October 22, 2006
Trade Ideas
This is the HANS chart - see the "dummy spot" at the 6th stick? This is followed by a confirmation in the next stick and that is a wonderful place to buy. Especially if it is a stock you trust to go up. The reason why I trust it to go up is because so many other traders are gaming the same spots. Consequently we all see the same thing and we all make the same buying action.
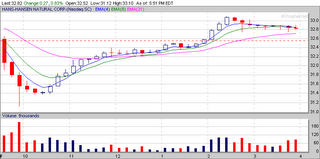
I also watch for high volatility stocks that have dropped as a result of a bad earnings report. For example CTXS crashed and burned on Thursday and now it could oscillate up and down for several days to weeks and might prove to be like a fruit tree in a garden and provide numerous opportunities to harvest profits on a daily basis. SNDK is another one in that genre - took a 20% haircut on Friday - I'm keeping it on a watch list and am going to try to harvest a number of opportunities from it. HANS has also been a good “earner” for me in that it is up and down like a yo-yo. In the last 15 days there were 10 opportunities to take a day trade long in HANS.
You don't need a crystal ball just an imagination and a good set of charting software. I use prophet.net and find it excellent - you can try it out for free you just won't get real-time charting capabilities but you will get real-time scans. I get nothing from this endorsement so go ahead and give it a looksee.
SMH vs SWH

What I did was download the historical daily closes for the two ETFs, add them together, divide by 2, then divide each one by the result of the third step and plot the final product and what you see is the SWH running way above the SMH. You also see that in the past these two have stayed pretty close to one another. This diversion began about 100 trading days ago or earlier in the summer or about the time of the last earnings reports.
The idea now is that the black line will close up towards the red line and vice versa. Now needless to say but say it I will - that doesn't have to happen - in other words software can continue for a long time above hardware and in fact never come back to meet with it - this probably won't happen but it is possible.
All I wanted to do was show you a different way of looking at the situation since I've never been able to understand those xyz:abc charts. And this, I think, shows the situation in a much better light.
Process Trading
Note I didn’t title this “the process of trading” which would be a completely different beast. Process trading is what most of us do except we haven’t named it as such. These are not rules – rules are things like “don’t trade when you are sick” or “let your profits run”. A process is different in that it ensures that every trade you take is taken in the same manner for the same reason with the same expectation of results. A process contains three parts – the sequence of steps which ensures everything remains orderly, the “rules” or the “what” of the process, and the “method” or the “how” of the process. Most people just write down a set of rules or “whats” without taking into consideration the how and the when. The method is probably far more important than the rules because it is the method that ensures consistent results.
Here is an exampleGap-Down Process for Longs
| When | What | How |
| 1 | At 10 A.M. Collect target stocks. | 1. Using (my collection method) collect a list of candidate gap-downs (my criteria for candidates) 2. Transcribe the list to (my charting software) watch list |
| 2 | Set-up watch list charts for initial observation | In (my charting software) set
|
| 3 | Every n minutes thereafter until | A dummy spot was formed in the last n-minute increment - The last n-minute increment low is higher than previous 2 or more declining lows - The last n-minute increment formed a white hammer-like formation that follows 2 or more declining lows |
| 4 | Given any one of the several targeting criteria in sequence step 3 - Wait one n-minute increment for confirmation | Did a white candle form following the targeting criteria? |
| 5 | If yes - purchase stock | Open a session with (my brokerage account) and follow (my trading process) |
The trading process includes algorithms for numbers of shares to be bought, where stops are to be set, and a method for exiting the trade if not stopped out.
Now if you identify all of your trading set-ups long and short in this manner you will be a far more successful trader in the end.
Saturday, October 21, 2006
Friday Wrap-Up - Late Edition
I made some money on Friday - I played RHAT and CTXS both off a gap down dummy spot entry point. Didn't hold either trade very long but that is the nature of such trades - if the market is booming up they go for a long time - if not they are short time make some bucks and out types. Don't matter - both can be satisfying (wink wink). Anyway for those of you who have forgotten - this is a dummy spot trade:

See the third candle - that is a "dummy spot" AKA "doji". The entry is at the high of the doji. My exit was the "tweezer top" shown in the 7 and 8th bars but the dummy spot in the 9th would have gotten most folks out anyway. A "tweezer top" is one where two candles in a row have the same high and the first candle is white and the second is red. The "tweezer bottom" is the same but at the lows and the second candle is the white one.
For Monday we could be looking at another mixed day. The up/down ratio is just about into buying territory at 40% (less than 40 is buying territory) and the new 20 day highs have backed way off to 578 - the closest they have been to 500 in 2 weeks and the new 20 day lows hit 241 which is the highest it has been in the same time but the VIX is now more than 5% below its 10 day average.
Now the VIX is tricky - it really doesn't matter much until it is at least 10% above or below its 10 day moving average and it matters more at the top than the bottom - so while it is a warning it is weak at the same time and could pull back into neutral with no adverse affect.
On the other hand the DIA finished in the red and the SPY and the Q's went white in the last hour which generally, used to mean a good day the next day because traders where squaring their positons in a positive manner.
Now I don't know what all this means but it could be that the markets are going to go down next week to end October the way they should have begun it. Also it is the week following options expiration and that is generally a quiet time.
Earnings are good for those of us who day trade the long side because they make for volatility in the market. They are especially good because when they come in bad there is no place for the stock to go but down and sometimes when they come in too good the stock also has to go down. Since there is no science to this - i.e. no one knows where the bottom is most often down is a lot further than it should be so you can pick up some real good winners riding them back up. That's what is going on in CTXS and that is as close to a stock tip I will ever give.
The magic coin or Mr. Majestic as I'm starting to call him is 21 and 10 because although the INDU was down the "market" is actually the SPX and it was up. For Monday - heads - bull again - we'll see.
Friday, October 20, 2006
Thursday is a Wrap Day
The up/down ratio is 54% not really out of the neutral zone yet and the new 20 day highs keep moving up way into critical territory now - 995 as the new 20 day lows languish at the bottom printing 155. The VIX remains irrelevant to anything but the three sisters all printed white candles in the final hour of trading. A good sign but this is a weak market that needs to go down before it can resume a healthy climb.
Mr. Magic Coin is 20 and 10 having gamed today correctly and for tomorrow --- heads bull market again.
Wednesday, October 18, 2006
Wednesday Wrap Up
The up/down ratio sits at 43% and new 20 day highs are still above 500 at 698 with the new 20 day lows at 148. Still not much to buy but the VIX is in neutral teritory and the three sisters all finished in the white. Earnings keep coming in well but earnings really don't matter when the market is so oversold. There are a lot of unatractive stocks out there right now. I think we should go down tomorrow despite earnings.
The magic coin only got one out of three right today among the sisters but I'm going to say it was wrong anyway so it sits at 19 and 10 which is still not too bad and for tomorrow it says --- heads - the bull is back.
The Joker's Wild and the Joke's On You
Anyway those of you who follow along here (thanks Mom) know that the real reason the market behaves as it does is because the magic coin is directing it ... actually you know that when there is nothing to buy people sell things and then, having sold, they look around and say "oh - look at all the wonderful things to buy" and then buy them.
This is like two neighbors, you and me say, each having a yard sale and we buy each others junk every week or so and cart it into our houses. We both feel good about selling off the old stuff and getting some new stuff but stuff is stuff - if you get my drift. Then, just like in a yard sale, every once in awhile a new buyer rides through the neighborhood and throws a potful of new money into the mix and the cost of junk goes up.
So remember it isn't inflation, or earnings, or anything else anyone else says - it is the availability of junk to be bought at a price that someone else will pay that makes the market go up. And when no one will pay the price the price comes down until someone does pay and that's what makes the market go down.
And if you don't believe me - well go back to the magic coin it makes as much sense as using something inmeasurable but continuous such as inflation or one number out of a sea of numbers that are constantly changing such as earnings.
Tuesday, October 17, 2006
Rainy Days and Tuesdays Always Get Me Down
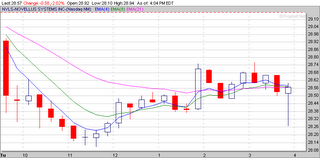
Does anyone see anything that even partially looks like that in this???

No? Are you sure? Ferris? Ferris? No? Me neither - so guess which one I bought and if you guess NVLS you are just being a smartass. I did the bad thing three times - not being satisfied with just one - fortunately I managed to escape with only minimal damage but damage all the same.
I guessed right today as far as market direction - down - but that was easy. Tomorrow is shaping up as a buy the dip day - the up/down ratio is 32% and the new highs pulled way back to 665 and the new lows increased to 140. The VIX is back in the neutral zone and the only fly in the ointment is that the three sisters all finished the last hour in the red.
I still think it is buy the dip and up up and away.
The magic coin is 19 and 9 having called today correctly and for tomorrow --- tails - bear market again.
Previewing Tuesday
In the two white angel format I take the open of the third 15 minute bar. In the three down with a dummy spot I take the next price that exceeds the high of the doji.
We'll see how all of this turns out later but that is what I am looking for in a down market.
Monday, October 16, 2006
Monday Boring Monday
I think that is coming. The up/down ratio is .59 creeping towards a breaking point, the VIX is 8% below its 10 day MA, 1668 stocks achieved 20 day new highs and 107 hit 20 day new lows. All the sisters finished the last hour in the red. And it wasn't some wishy washy pink but a deep red. All of this put together suggests that tomorrow could be a down day.
The magic coin is 18 and 9 having misread the tea leaves again today. For tomorrow ... tails - bear. We'll see.
Earlier I posted regarding gold and oil - for the record both went up today. I think they will continue to do so for awhile.
What a Boring Day
I took a position in ATHR - a gap up (for a change) that did one of my favorite moves - retreated to 8. That looks like this -
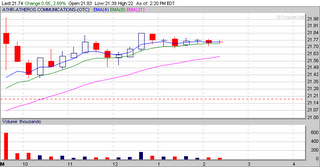
You see the 4th bar hits the 8 EMA (the green line) and takes off from there - I use "takes off" in a literal sense because it went pretty much no where. I'm out just before 2 P.M. for a 25 cent gain.
Oil and Water
Here is oil and gold from a price standpoint (using the GLD and XLE ETFs as proxy)over the same time frame. Oil is displayed on the black line and gold on the (what else) gold line.

And here is a picture of the same price wise action using marlyn's curve. The same colors are used in this picture.

Aside from noting that they seem to move together you will also note that they are rising at this time. Also note that gold trails oil in price moves. So maybe you can use oil pricing as a signal to buy or sell gold. I don't know but that's the way it looks to me.
Pre Market Data
This morning OPEC is getting together to discuss oil production cuts - like that is going to happen - the only thing these guys can ever agree to do and succeed at is to disagree. If they do set quotas it is with the understanding that a lot of cheating will go on and absolutely no quota will ever be honored. I say that because you only ever hear of them getting together to cut production, never to increase it, yet it always increases.
Anyway that is the warning signal of the day but it doesn't seem to be affecting either the Asians or the European markets which are all in the green and strong and the futures which were in the red when I first looked at Oh-dark-thirty are now also green. Maybe the rest of the world has figured out what I figured out - OPEC production cut talks are full of something dark, stinky, and gooey and not oil.
The other thing I like to watch is the pre-market at the NASDAQ site. I don't trade pre-market - too much work - but I do like to watch it and I also like to check stocks that are on my hot list to see if they are catching a bid in the early morning light. Generally if they are I will then watch them more closely during the opening to see if I'm going to put on a trade or not. Some of the stocks I always look for are AMR, YHOO, and INTC. These are always good for a half a buck or better if there is some early interest.
The More I Trade
My problem as I find out from reading many other blogs is the same as most people - laziness coupled with an intense dislike for hard work - well that's not exactly true - I don't mind hard work as long as it is either interesting or profitable and preferably both. This past summer I grew tomatoes and cucumbers and peppers in a little garden I hacked out in my back yard. I had never grown any of these things before in my life although my father used to so I knew it was possible. I made a huge number of mistakes but I still harvested a ton of all the above and it was all tasty and nutritious. Next year I will remember my mistakes and I will be harvesting even more tasty and nutritious vegetables from my little garden. The best part of course was that I had so much I got to share it with my golfing mates and that was grand. Everybody will take home grown tomatoes for free.
Now the laziness part is easy - had I bothered to study the problem first before starting my little garden I probably wouldn't have made half as many mistakes - but true to my nature I just jumped right in - bought some sets, threw them in the ground applied water and waited for payday. On the other hand had I not been lazy and had I studied the reams of documentation available I would probably have not had a garden in the first place because I would have learned how freaking difficult it was to do. It wasn't - but the documentation makes it seem that way.
Same thing with trading stocks for a living.
One thing I seldom talk about on this site is risk - other sites are laden with "risk this" "risk that" "I made xR on the trade" - but you won't find much talk like that here. Most of the time I don't bother with stops because I had them in the past like a good doobie and a couple of stocks dropped right through the mothers and kept on going South - they don't tell you about that in the books - what they say is - oh, you should have had "market stops" - well that is a bunch of crap too because most stocks after a steep and rapid decline actually rebound a bit and guess what - a market stop dumps you out at the very bottom and you don't get any of that rebound back. So I use mostly mental stops and if I have to go away from my monitor for very long I set a hard stop and hope for the best. Point being they only protect you from the known and you should only fear the unknown - I hope you get the idea.
I think it is up to everyone to determine their own appetite for risk and that can't be taught like a good set-up. It can only be suggested and then only mildly. I still think you should go into a trade with two targets in mind - how much you want to make and how much you can stand to lose and then you should adhere to those two targets as if they meant something.
Saturday, October 14, 2006
Friday Wraps The Cake
I took a small, just for fun trade in GLW off a narrow range bar on GLW (what some call a "dummy spot"). I like this trade in that it usually signifies a win - it just took a long time to develop. I sold it just before 3 (at the "dummy spot" that formed there - dummy me)and gave up a goodly portion of the day's gains - oh well - at least I made a buck on a just for the fun of it trade. In fact I covered my loss from yesterday so I was pretty satisfied with that - not.
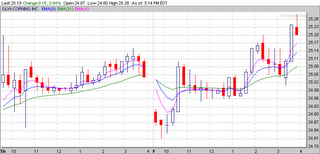
God knows what next week brings and she isn't telling. But this is now begining the second half of October and, guess what, the market is traditionally supposed to heat up. I think it probably will for one reason only - the new 20 day highs have been booming with this latest record setting activity and while the Dow might be running out of steam the rest of the market (the other 7000+ stocks) doesn't seem to be.
The up/down ratio is only 51% which is neutral, the new 20 day highs drew back to 1397 and the new 20 day lows increased all the way to 137. In actuality that ain't much of a change on either side. The three sisters were all strong white on the last hour and that is not necessarily a great sign but it is good. The VIX just meandered more than 5% below its 10 day so we might get a bit of a correction early next week but it might not happen either.
The magic coin now holds an 18 and 8 record and for Monday it says ... tails - bear - well keep calling the same thing every day and one of these days you will be correct.
I'll be back later I want to talk a bit about day trading vs buy and hold.
Thursday, October 12, 2006
Thursday Wrapping It Up
Tomorrow should be a day of rest - this market has got to be tired. The up/down ratio is 68% and the new highs vs new lows is running 1525 to 117 an incredible spread. The VIX is 5% below its 10 day moving average which is always troublesome. Two of the three sisters finished the day in the red. So I think it will take a rest tomorrow and I will too.
The magic coin called out the bear and was wrong so now it sits at 18 and 7 and for tomorrow it says ... tails - bear is coming.
Wednesday, October 11, 2006
Wednesday Wednesday Wednesday - Wrap
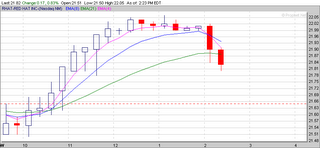
Hint - look at the candle formation at 11:30 followed by the one at 11:45. AMD I bought off the narrow range bar at the second 15-minute candle and the fact that the SMH (the semiconductor holders ETF) was going ballistic in the second 15 minute period. RHAT was also bought off the NR bar in the second 15-minute candle. I dumped both RHAT and AMD at half past noon and that was a little premature for AMD but just about right for RHAT.
YHOO I dumped at 3:45 for a nice little profit - kind of a desert off the morning's meal.
Tomorrow is shaping up as a potentially bullish day - the up/down ratio is 34%, the new 20 day highs have backed off to 534 and the new lows hit 271. All three sisters finished the day in the white and that is always a good sign when coupled with the up/down ratio. The VIX stays neutral - hardly moving at all. My newest market proxy - Goldman Sachs not only finished the last hour in the white but it also finished the day green. As a result I'm giving the magic coin the day as a bullish day because even though it started off down it came back strong in all regards.
That makes the score 18 and 6 which is fantastic for a coin flip - for tomorrow it says .... tails - the bear is coming. Oh, it's just a coin for crimenelties sake!
Tuesday, October 10, 2006
Tuesday Wrrrrrrrappppp!
The DIA finished in the red, the SPY finished with a doji and the Q's finished with a strong white candle. The VIX lost the 11 cents it gained yesterday and that puts it firmly in the neutral zone. There is no there there. I.E. more of the same-o.
The magic coin is 17 and 6 having missed today - for tomorrow - heads - bull coming. I think so too.
Monday, October 09, 2006
Monday Wrapata Wrapata Wrapata
Tomorrow is shaping up to be more of the same - let's face it no bad news can possibly shake this market.
Two of the three sisters finished the last hour strong and the third, Q's, did a doji dance. GS finished up strong. The up/down ratio sits at 50% which is a big Idunno and new 20 day highs increased to 866 as new 20 day lows remained low at about 184 only 4 different from Friday's close. The VIX remains neutral but what's new with that - volatility as a whole is down which suggests more of the same more of the same more of the same.
Meanwhile silly magic coin is 17 and 5 having called today correctly. I wrongfully gave Friday to the magic coin and shouldn't have so I've had to back it off at the top and add on to the bottom. Still impressive all told. For Tuesday - tails - the bear is coming - just as well as I'm taking the day off.
Saturday, October 07, 2006
GS As a Market Proxy
Here is GS overlayed with SPY on their weekly charts. Note that the two dance together very nicely.
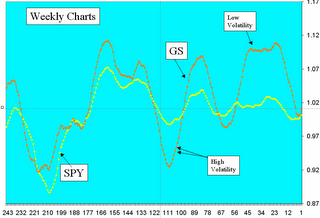
But also note one more critically important item - GS volatility is much more visible than is the SPY's. That is very important. It is important because you can use the volatility indicator (or lack thereof) to signal market turning points. When the volatility goes out of GS - and it is obvious when that happens then, in most instances, we are coming up to a major turn in the market. Note that volatility has just increased in GS after a period of low volatility - and it seems to be turning up. What do you think that means?
Itsa Friday Wrap

This is an opportunity trade in that I happened to read the headline where Kerkorian's man quit the board and then looked at the chart at the right time in the right venue (4 minute bars). I wasn't considering a trade but the set-up (a piercing arrow hammer at 30 past) was so sweet I had to get on board.
It is possible that the current run will continue. The up/down ratio dropped all the way to 35% and the new 20 day highs pulled way back to 582 from 1234. Of course the new lows went nowhere and that might be a good thing. It might suggest a certain amount of internal strength to the market. The VIX remains neutral. The three sisters all finished the day off their lows - all of them starting their recovery right after noon. It appears to me that the volume in the afternoon was just as strong as in the the morning so yes I'd have to say that a recovery was in process.
Now the first week in October generally is a down or sideways week and this was anything but so I think (emphasis think) the market as a whole could continue its upward trajectory.
The magic coin is 18 and 5 having called Friday a bull which it was since every major index finished up and white. Next time ... heads - bull again.
I'll be back later this weekend with another post about Goldman Sachs and how it might be considered a proxy for the market as a whole.
Thursday, October 05, 2006
Thursday Wrapping the Fish
The numbers however say it shouldn't. The up/down ratio remains at 60% and there are 1234 new 20 day highs vs only 126 lows. That in and of itself should make the market go down - there literally isn't anything left to buy. The VIX remains neutral and the three sisters finshed the last hour in the red, but weakly. Who knows?
Maybe the magic coin - it's now 17 and 4 having called today correctly. For tomorrow ... heads - bull market again.
Buy Me Buy Me Pleeeease Buy Me!!!
When you see one of these you can be fairly certain (80% or so) that it will go up. I like waiting until the third candle (and in this instance actually waited until the 5th) for a confirmation. I bought this off the "retreat to 8" set-up that I like so much which actually gave the trade a much higher probability of success.

Class dismissed.
Wednesday, October 04, 2006
On Wednesday We Wrap
Tomorrow who knows - the up/down ratio is 66% and the new 20 day highs vs lows is 1104 to 220. But the VIX stays neutral and the three sisters finished strong white.
I think it is a toss up and I refuse to call it. We'll just have to wait and see.
Old magic coin is 16 and 4, two misses in a row - for tomorrow - heads - bull market - who knows.
Tuesday, October 03, 2006
Another Crappy Tuesday Wrap
I expected the market to finish strong at the end of the day not start strong and then fail. I think tomorrow it reverts to form and goes down - no matter I'm flat.
One of the stocks I traded were AMR on the oil decrease. It was steaming up and then the pilots union started screaming about raises now that the airlines are recovering - what a bunch of jerks - I sold at breakeven including commissions. I also played CSCO off the 4 minute charts where the 4 EMA crossed the 21 EMA going up. I dumped it at about a dime because I didn't think it was going anywhere and it turned around and continued up. I had H for awhile until the collapse this afternoon where it dropped and stopped out. Fortunately I had moved my stop to a profit level about 14 cents above my buy point. What absolute crap.
The magic coin is 16 and 3 since it missed today. For tomorrow --- tails - bear again. I agree this market has got to go down in order to get some volatility.
Volatility – We Don’t Need No Stinking Volatility
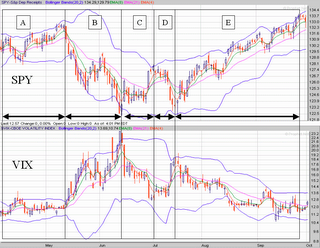
The figure shows how the VIX and the SPY interact across relative to their own volatility. And how the SPY reacts relative to the VIX. In this 6-month period (through yesterday 2 October 2006) I’ve outlined 5 regions of change. In the “A” region we see a period similar to now (“E” region). The SPY is flying high and the VIX is running low. The volatility bands are narrow for both articles. In the “B” region volatility begins to expand and the VIX rises as the SPY falls. Note that the VIX did not cause the change but the violent downward price action of the SPY caused the bands to expand. Note how towards the end of the “B” region the volatility bands for both the VIX and the SPY begin to contract once more indicating a dampening of volatility for both indices. There is a mild transition through “C” and “D” leading into the “E” region.
While bands can stay contracted for awhile the fact is low volatility as is seen here must give way to higher volatility or the market will end. Volatility is the pulse of the market without it there is no market. Consequently I think we are in for a period (weeks not months of volatility expansion) before this market can go much higher.
Monday, October 02, 2006
Moday Wrapping
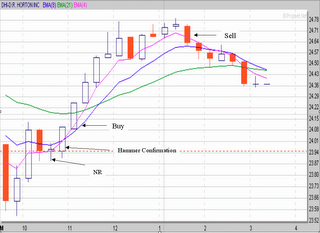

This set-up is a good earner. It is simple - a gap down followed by a narrow range bar (NR), confirmed on one of the next two bars with a hammer or hammer-like formation and then a buy on the breakout. I like waiting for a healthy confirmation but either of these trades could have been taken sooner. I use the lowest low previous to the NR bar as my stop.
You can see how both these trades ended with the market collapse around 1 P.M. I was watching them fairly closely and they stopped advancing well before I sold and I probably sold a few cents late but none of this is rocket science - you go in when you feel comfortable and you leave when the comfort leaves.
I like playing gap downs more than I like gap ups. I can play the gap up but only when the price pulls back to the EMA 8. The next time I get one of those trades I'll share it with you.
For tomorrow we are looking at a moderate start, a bottoming of the indices in the first 2 hours and then an explosive finish to end the day. I base this all on nothing more than intuition and instinct and we all know what that is worth.
The up/down ratio sits at 33% which is excellent - the new 20 day highs went down to 313 and the new 20 day lows went to 478 - a huge jump from 324. Unfortunately the 3 sisters all finished the day in the red. That is a weak indicator however the strongest indicator is the up/down ratio which is sub 40% for the second day in a row.
Little magic coin is 16 and 2 since it once again called today's action perfectly - for tomorrow it says ... tails - bear again. Ok - but I'm not betting the farm on it.
Monday Monday How I Hate That Day
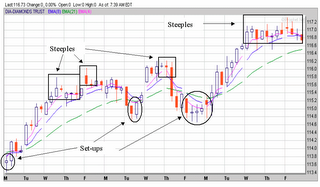
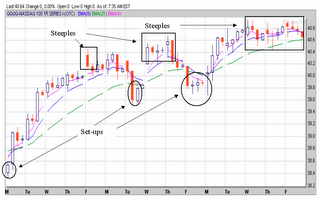
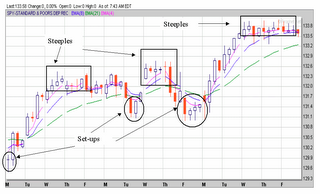
See what I call "steeples"? I call them that because they remind me of seeing towns in Europe from a distance and the only thing you saw at first were the church steeples long before the town itself became clear. I think the Japanese dubbed these castle tops or something like that.
These are generally topping indicators although they could also be indicating a consolidation. There are two other examples in the figures (from prophet.net - an excellent site) of the steeple formation. I've also noted a couple of set-ups for future reference.
I like the 2 hour charts as indicators because the period is long enough to make sense of the nonsense but still short enough to be useful for day trading. Now, of course, you don't have four 2-hour periods in a single trading day. So even though they are two hour charts the last one is actually only a half an hour. (Actually, in this case, a little longer because these instruments (SPY, QQQQ, and DIA) don't settle until 4:15 - but that's another story).
Sunday, October 01, 2006
Thursday/Friday Wrap It Up Day
Anyway it looks to me that the market is now poised to make another run since the up/down ratio has receded to 39%, the new 20 day highs are less than 400 and the new 20 day lows are increasing. The VIX continues its march in the deadband (+/- 5% of its 10 day moving average) and the three sisters all took a well deserved rest in the last hour on Friday and closed in the red. Given the interest on the day that is not surprising.
October is a strange month - it is the transition from Summer to Winter and most of the markets gains happen through late Fall into the Spring. In 2 of the last 6 years the market (based on its proxy SPY) has finished down in October so October mostly finishes on an up note. In the last two years the first three weeks went down and the market then recovered momentum in the last week. Three years ago we had a first week up, next two down and the fourth week up. So October is hard to predict except that generally speaking the market will finish the month up.
But one has to be careful in October - some of the worst single day crashes in the market have occurred during this month. Not lately but there have been some big ones in the past.
The magic coin is now 15 and 2 because I'm going to say Thursday was definitely a bearish day since two of the three major indicators (DIA, SPY and QQQQ) finished below Wednesday. Friday there was no call. But for Monday the little bugger says ... tails - bear in the air. As always, we'll see - I can hardly wait.
