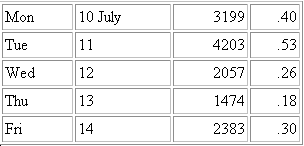
We can differ on the totals but I use 7858 as the base value. The table shows the percentage of upward bound stocks on a daily basis this past week.

From the list we can see that the worst day this week was Thursday when only 18% of the possible shares went up. On Friday this was back to 30%. These numbers are reflected in the candlesticks for these days.
For Thursday the SPX printed along black stick with hardly any tail but on Friday a black hammer was printed - a tail longer than the body. I would feel better about the coming Monday if that had been a white hammer but sometimes, as we have seen in the buy-me formations, you take what you can get.
I'm not suggesting or saying that Monday is up, I just wouldn't be surprised to see a bit of a rebound next week.
But maybe not - always remember rule #1 - nobody knows nothing.

No comments:
Post a Comment