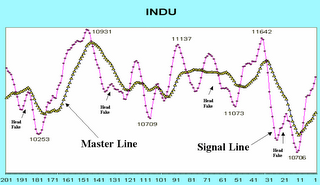
I call this oscillator Marlyn's Curve.

Because you won't find this on any commercially available product there is no sense in explaining the calculation to you. But as you can see there are two lines, a master line and a signal line. The signal line often does what I call a "head fake" which is something I borrowed from John Bollinger's Bollinger Bands. The head fake is when the more sensitive line anticipates a turn and turns early. I have learned to ignore that turn but to prepare for a major turn within 10 days or so.
I generally take trades when the master line turns up which is usually several periods after the signal line makes its head fake. I was also playing the Rydex inverse funds on the downturns but will now begin playing the new Proshares inverse ETFs instead. Easy in and out.
Yes the price annotations are correct since this oscillator doesn't value magnitude so much as direction. The overall period shown is the past year in the market. You can see as well as I can why you couldn't make much money for the past six months. The market had no clear direction during much of 2006. Consequently it was neither a bull nor a bear.

No comments:
Post a Comment