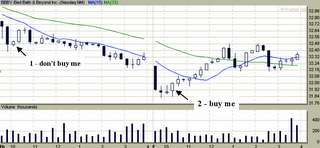
At point 1 we see a small white candle at bar 3 and itappears as if the stock is turning around. The climb never exceeds the long black candle at bar 2 and finally at bar 5 resolves itself as a doji. That is the first real indicator that this is not a good buy.
On the very next day we get a long black candle gap down. This is followed by a spinning top (indecision) and then a black doji. The fourth candle prints a hammer (2) and that says "buy me" to all who care to listen to the market.
As usual the charts come from Prophet.net - an excellent site.

No comments:
Post a Comment