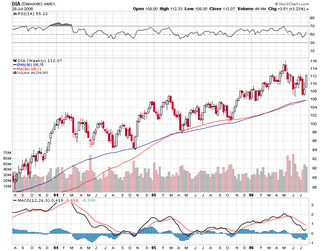
The lesson - sometimes the SMA tells the story but the EMA always tells the story.
The second lesson, of course, is that the DIA (and INDU you can look it up) seems to use the 90 day EMA as a support area.

The figure comes from Stockcharts.com. A super site for very sophisticated charting software. If you don't use the site you are foolish.

No comments:
Post a Comment