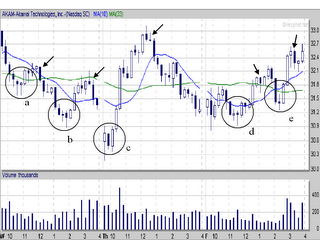
The setups at a and b are signalled by hammer formations after declines. The c setup is the best, a gap down with a long tail, a black candle followed by a long white candle. D and e both have a hammer print after a decline. If you were feeling good about the trade you might not have sold the d entry until the end of the day.
Again the chart is from prophet.net - an excellent site.

1 comment:
...please where can I buy a unicorn?
Post a Comment