Last day of the month (not Friday as I said last week). Last day is usually pretty mild and moderate and this one is about right. I'm taking another day off and will be back to trading tomorrow - maybe.
Still holding INTC but that's all folks.
Update - saw the VIX turn around and I went fishing. Found ACI and rode it for a nice gain. Finally decided to sell INTC. No use in holding it - I can buy it back again if it starts to ascend.
Currently I am absolutely flat and that is probably a good way to be to start August.
A lot of pressure came off the VIX today - went from being 10 points under to only 6. Also lost some pressure from the up/down ratio - it returned to a neutral setting. The new 20 day highs still remain above 500 so that might mean a little rocky start to August.
We'll see.
Monday, July 31, 2006
The Rules
I have to revisit this subject every now and then more for myself than for anyone else. Rule 1 - nobody knows nothing - including me. Rule 2 - when in doubt trust your instincts - if it feels wrong it is wrong and no amount of hoping can make it right.
Rule 2 of course is the corollary to rule 1 and the whole package means be true to yourself.
If you follow those two rules in life as well as in investing you will probably come out OK.
Rule 2 of course is the corollary to rule 1 and the whole package means be true to yourself.
If you follow those two rules in life as well as in investing you will probably come out OK.
Sunday, July 30, 2006
EMA 90 What A Tight Rope
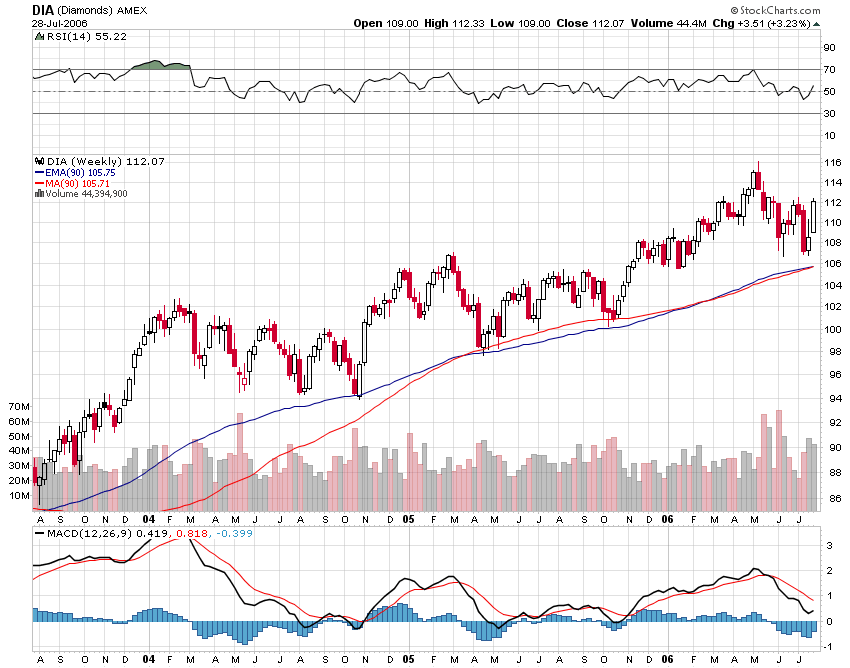
Many traders myself included use the simple moving average which is probably a mistake. Here is a figure of the DIA with both the SMA 90 and the EMA 90 overlaid. Note how the DIA has been on the 90 day EMA and only recently the 90 SMA joined the mix.
The lesson - sometimes the SMA tells the story but the EMA always tells the story.
The second lesson, of course, is that the DIA (and INDU you can look it up) seems to use the 90 day EMA as a support area.
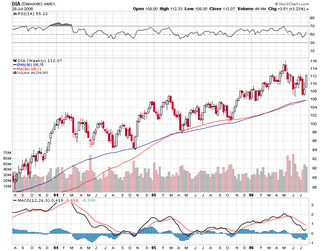
The figure comes from Stockcharts.com. A super site for very sophisticated charting software. If you don't use the site you are foolish.
The lesson - sometimes the SMA tells the story but the EMA always tells the story.
The second lesson, of course, is that the DIA (and INDU you can look it up) seems to use the 90 day EMA as a support area.
The figure comes from Stockcharts.com. A super site for very sophisticated charting software. If you don't use the site you are foolish.
Saturday, July 29, 2006
20 High 20 Low
I did some analysis of close at 20 day high vs close at 20 day low and found some interesting things. First bottoms are generally indicated by high numbers of 20 day lows vs low numbers of 20 day highs. And, conversely, tops are suggested by the opposite configuration. Which makes sense. When the market hits extremes in either direction it reverses.
What I saw is that after several days of high numbers for either axis (i.e. anything in excess of 500) the market starts going in the other direction. It doesn't generally happen overnight because I think it takes a little while for the trading community at large to catch on to the "new" fact of the market. What is the "new" fact of the market? When there are lots of stocks hitting an intermediate bottom, i.e. the 20-day low, then there are lots of buying opportunities. Obviously the more buying opportunities there are the more buying that will take place and vice versa.
The last 4 days have seen 594, 584, 380 and 836 20-day highs respectively. That would suggest that there are lots of stocks ready to be sold. It wouldn't surprise me at all to see a market decline next week.
Friday, July 28, 2006
One That Got Away - VSEA
This is the one I mentioned earlier that I mistakenly sold instead of adding to the position. I know, I know it's a lot of money and you should be 100% on the job. Unfortunately I was thinking about 3 other positions at the time and not paying much attention to what I was doing. This morning was a gold-mine of opportunities just waiting for the digging.
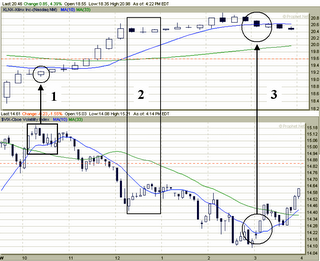
Anyway it was a gap-up (1) that I found using prophet.net software at 9:45 this morning. I watched it for another 15 minutes and once it formed the hammer above the opening bar I said this is probably for real. At 10:15 I took the trade (2) and about 15 minutes later I was going to double up because I saw the VIX starting to collapse. Oh well. Had I kept the trade I would have off-loaded around noon (3) right after that black candle.

Anyway it was a gap-up (1) that I found using prophet.net software at 9:45 this morning. I watched it for another 15 minutes and once it formed the hammer above the opening bar I said this is probably for real. At 10:15 I took the trade (2) and about 15 minutes later I was going to double up because I saw the VIX starting to collapse. Oh well. Had I kept the trade I would have off-loaded around noon (3) right after that black candle.

Friday
Boy did I ever screw-up. I grabbed some VSEA at 29.80 and when trying to add to it at 30.10 sold it instead and then didn't check until later. Later, after it crossed $31.00 that is. What a maroon. Don't know why I was so distracted but as they say crap happens and I'm just happy I made a couple of bucks anyway. No sense in crying over spilled milk.
Still holding INTC although it has reached my target. I'll hang on for awhile longer and see where it goes.
Sold TGB and am passing on the gold miners for awhile. I don't like the way they are behaving and would rather not hold any just for a couple of cents of appreciation. Better off keeping my funds ready for a better score on Monday.
Maybe Monday I'll be ready to concentrate better. I'll post the chart on VSEA later and you will see what I found appealing.
Thursday
Well I take off to play some golf and look what happens market sells off. Friday doesn't look too good either so I might take the day off again.
It's the last day of the month and that is generally benign. The Up/Down is 35%, the VIX is still 10% below its 10-day average and a new factor, the percentage of stocks making 20 day highs vs 20 day lows, is 68%. Taken together these three factors point to a rough several days ahead (although not necessarily Friday).
On the plus side is the fact that the three sisters (Q's, DIA, SPY) all printed strong white candles in the last hour. While that only works about 80% of the time it might be an overriding factor.
My PXE position was stopped out for a profit. I'm still holding INTC and EZM but today I'm dumping EZM and picking up TGB. EZM is a non-performer. I'll reacquire oil for the weekend.
Thursday, July 27, 2006
Riding the VIX Part 2
Another good example of how to use the VIX to key a trade.
Reference the figure.
1. On 7 26 2006 around 10:20 the VIX printed a topping formation. XLNX was already ascending but the 10 o'clock formation (a gravestone doji) suggested some uncertainty and perhaps even a reversal. But with the VIX topping it printed a hammer which indicates a continuation up.
2. Things begin to calm down in the noon hour and you can see that after throwing off a hanging man (reversal signal) at 12:15 the VIX then printed a hammer of its own. Note that XLNX reacted strongly to that with a black candle but that was a spinning top (uncertainty) so the trade could be kept until some confirmation appeared. This was followed by a another doji (uncertainty, maybe reverse, confirmation required) and then a white candle that reflected the VIX rolling over down once again at 12:45.
3. While this trade should have ended with the XLNX hanging man at 2:30 the third entry shows that when the VIX reascended through its 10 and then 33-period moving average at 3:15, XLNX followed suit by descending through its 10-period average at the same time. This would have been an absolute signal to end the trade at that point if you were still hanging on.
Again the figures are from prophet.net - an excellent site.
Reference the figure.
1. On 7 26 2006 around 10:20 the VIX printed a topping formation. XLNX was already ascending but the 10 o'clock formation (a gravestone doji) suggested some uncertainty and perhaps even a reversal. But with the VIX topping it printed a hammer which indicates a continuation up.
2. Things begin to calm down in the noon hour and you can see that after throwing off a hanging man (reversal signal) at 12:15 the VIX then printed a hammer of its own. Note that XLNX reacted strongly to that with a black candle but that was a spinning top (uncertainty) so the trade could be kept until some confirmation appeared. This was followed by a another doji (uncertainty, maybe reverse, confirmation required) and then a white candle that reflected the VIX rolling over down once again at 12:45.
3. While this trade should have ended with the XLNX hanging man at 2:30 the third entry shows that when the VIX reascended through its 10 and then 33-period moving average at 3:15, XLNX followed suit by descending through its 10-period average at the same time. This would have been an absolute signal to end the trade at that point if you were still hanging on.

Again the figures are from prophet.net - an excellent site.
Pre-Thursday
Futures are up this morning as was Asia and as is Europe/UK. Gold jumped 8 bucks overnight because of the dollar slide. The Yen broke out of its trading range and is appreciating in value as is the Euro. Earnings are streaming in and seem to be overall strong. What's not to like?
I don't like the NR7 formation I see on all of the major indices. An NR7 is the "narrowest range in 7 days reading" and often precedes a change in market direction. Yesterday, of course, was an up-down-up-down day, totally psycho. Obviously there is enough cash on the sidelines to lift the market and enough sellers to dump it again. Glad I'm sitting this out.
The other thing I don't like is that the up/down ratio dropped again, this time to 47%. That is a neutral reading but taking it in sequence what we see are fewer stocks going up every day. That suggests a weakness in the market.
The third thing I don't like is that the VIX is better than 10% below its 10 day moving average.
Given those three things coupled with increasing earnings, end of the month festivities and a high probability that the Fed is done in August and this market is about ready to implode.
I think what it needs is a good flush-out to prepare it for the Fall. I wouldn't be surprised to see it go sideways-down into Friday then down-sideways into the Fed meeting. Then have a brief day or so of exuberance and then drop again until mid-September.
Later this morning I'll post a set-up using VIX and a stock from yesterday.
Wednesday, July 26, 2006
Wednesday
Interesting day. The VIX misprinted a spike so I switched over to the VXO. I did a study some time ago and found that there is little difference in the vectors between the two of them with the exception of magnitude. But that cuts in both directions - i.e. the VIX can lead or the VXO can lead. Six of one half a dozen of another. (Even though I'm not trading I am watching and learning).
About 10:15 on the 5 minute charts the VXO started looking weak. This only becomes obvious if you continue to observe until about 10:30. At that time I noted a gap-down, NSC (almost $6.00 down from yesterday's close), started stirring. One could have gotten in for about $40 at that time and by 2 P.M. it was at $41.25 ending the day at 41.50. This would have been a nice scalp and all you had to do was watch the volatility indices for your tip-off and have a list of gap-downs ready to go.
I lost 4 cents on INTC, 1 cent on EZM and gained 54 cents on PXE - so a good day with some profit to show.
Taking one more day off from trading tomorrow and will see what happens on Friday.
Riding The VIX
I use the VIX to help me pull the trigger on trades. The method is simple. I keep a chart of the VIX on a 5-minute basis on my screen at all times. If it prints a topping formation it tells me that I should be able to either take a long or close a short. If it prints a bottoming formation it tells me to either close any short term longs or to get short.
The figure shows this effect. The VIX is on a 5-minute basis. That permits me to be able to observe it over a 15-minute period to ensure that the signal is accurate. The object long is on a 15-minute basis. This one worked all day long even though the VIX flattened out in the mid-day period.
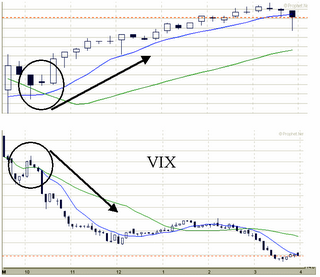
As with any trading idea you might see here or anywhere else it pays to investigate and evaluate on your own. Don't take my word for this - try it yourself and see if it fits your trading style.
The figure shows this effect. The VIX is on a 5-minute basis. That permits me to be able to observe it over a 15-minute period to ensure that the signal is accurate. The object long is on a 15-minute basis. This one worked all day long even though the VIX flattened out in the mid-day period.
As with any trading idea you might see here or anywhere else it pays to investigate and evaluate on your own. Don't take my word for this - try it yourself and see if it fits your trading style.
Tuesday, July 25, 2006
Tuesday
Well it looks like the fade the rally boys took the day off too. My holdings remain the same - INTC, EZM and PXE. All of them went up today. Gold hung around the 619 area all day.
The up/down ratio is 57% which is down from yesterday's 69% and more or less neutral territory. The faster Marlyn's curve flipped over going up 5 days ago and the slow curve rolled 2 days ago. We might be in a rally but once again I don't predict I just follow the TA and keep my stops tight.
The up/down ratio is 57% which is down from yesterday's 69% and more or less neutral territory. The faster Marlyn's curve flipped over going up 5 days ago and the slow curve rolled 2 days ago. We might be in a rally but once again I don't predict I just follow the TA and keep my stops tight.
Stop
When I first started trading placing stops was extremely difficult for me. Picking the right stop place is hard. Then once you do have a stop in place and the trade drops through it then rebounds to a new 52-week high in the same period - you want to go and hang yourself. I'm convinced that the book manager just sweeps close stops just to grab a quick scalp at the expense of the cowardly trader. That used to piss me off.
Then I realized that you are better off losing the trade to a stop loss than losing money. That's because for every sweep there are 10 instances when the stock drops through and keeps going down.
Now I use a simple rule of thumb - 20 cents for anything up to 10 dollars, 10 cents more per 10 dollars after that. So if stock cost $15 - I use a 30 cent stop, $45 - a 60 cent stop. These are for overnight trades only. For day trades I look at the volatility of the stock and if the stock is very volatile I monitor it and don't put in a stop. If I'm called away from my trading session I put in a tight 20 cent stop regardless of the cost of the trade.
The main rule of stops - don't look back. In other words if you lose the trade to a stop don't check it three or four times during the day because if it is going up you will be depressed and if it continues to go down you might be tempted to reacquire the trade. And if you do you will probably be really depressed later. I speak from experience.
Pattern Playing
Most traders who are successful have an edge, a method that they can return to when they need a score. I play patterns. I have found that given the binary nature of up or down many patterns of ups and downs repeat over and over again.
I use a pattern I call red-white-and buy quite successfully. One might call it my bread and butter pattern. This would be described simply as down-up-up. When I see this pattern in a chart I figure the next period or more is going to be up.
It is a little more complex than that as I always insist that volume, trend and 200-period moving average components meet my specifications too. For example, volume for the last 30 days must be greater than 250000 shares every day. The trend as shown by the 45-period linear regression slope must be positive and the latest close must be greater than the 200-period average. If the stock fails any of these basic tests I don't want to know about it.
I used to require a much stricter 1 million shares a day average for the past 90 days but I have found that to be overkill. If I were dealing in more than 1000 share lots I probably would go back to that requirement. I buy either 250, 500 or 1000 shares at a time. I may buy more than 1000 shares on a given trade but never on the same commission. I will sell up to 5000 shares at a time but have also sold 5000 shares 500 at a time.
I buy using limits and I sell using limits. My first ever trade was "at the market" and I will never do that again. Only because the "market" suddenly was 50 cents greater than it had been before or ever was again. One second after taking the trade I was down 50 cents a share and it never recovered.
The red-white-and buy or Down-up-up pattern works in any time period. But always keep in mind that nothing goes straight up nor straight down. Most of the time the stock market meanders sideways-up. Remember too that trading and investing are two entirely different things. A trader is always looking for a scalp and an investor is always looking for a dream. Sometimes dreams come true - most often they do not.
Monday, July 24, 2006
Monday
Strong day weak finish. If you've followed along for awhile you know that I consider a weak last hour to be a negative factor for the following day. We also have the very real fact that the SPX is pushing right up against resistance again at 1260. Basically the SPX took out the losses from Thursday and Friday as did the Dow.
The Q's however did not recover all of the Thursday/Friday loss. But all indices ended the day in an upthrust configuration which most likely will carry into tomorrow morning and then collapse through the day. If the end today had been stronger I think this rally might have a chance. VIX is at .08 off its 10-day MA and despite some people's opinion the science is clear - this means the market is once more poised to drop. The other factor is the Up/Down ratio which is 69%. Last week a similar reading after a similar up day resulted in two down days in a row.
I dumpted XLE (too early) and BGO (also too early) this morning. Dropped EXPE because in the face of an overwhelming upward momentum it went nowhere. Bought and sold WERN for the same reason. Held INTC and bought EZM both early and late. I bought PXE (an energy ETF) into the close in case the wild times continue in the Arab world.
I plan to take three days off from trading because I'm getting a little stale. So even though I will continue to post I just won't have any trades.
Saturday, July 22, 2006
Linear Regression Transition
The Linear Regression slope (LRS) is a very important technical analysis factor. It informs the trader of the general direction of the stock over a period of time. There are some traders that use the LRS as a means to track their trades, if a stock closes above the regression slope they buy it, below and they sell it. I’ve simplified the method and recommend that you read Chandre’s "The New Technical Trader" for a better explanation. Of course when the LRS is used in this way it is significantly shorter in length.
I like using the LRS in two ways. First I use the bands on each side of the LRS itself as a trading zone. For that reason I use a 45-period LRS. I’ve noted that stocks that close on the bottom line are prime candidates for rebound. I’ll discuss this method in more detail in another post. Today I want to talk about the LRS transition method.
Obviously because the linear regression method outputs a “slope” that slope can be either positive or negative or neutral. I’ve noticed that when the slope transitions from positive to negative a window opens for a little while for the stock to go up (and vice versa from negative to positive). The figure below of COCO shows this effect.

For Longs:
1. Linear Regression Slope (45 periods) transitions from positive to negative.
2. RSI(14) is in oversold territory
3. Stochastic RSI(14) is in oversold territory
4. Several periods later the stock prints a “buy-me” pattern.
Note that the stock is at the lower band of the LRS. This doesn’t necessarily happen.
For Shorts:
5. The LRS transitions from negative to positive
6. RSI(14) is in overbought territory
7. Stochastic RSI(14) is in overbought territory
8. Several periods later the stock prints a “sell-me” pattern.
Just prior to the transition the stock’s high touched the upper band of the LRS. Again this is not a necessary factor in the method.
While this doesn’t seem incredibly intuitive (a negative going slope signaling a positive going stock and vice versa) most TA is based on extremes within the confines of the stock’s normal price excursion or variances from the norm and not on direct cause and effect. Think about it for awhile and you would agree – if it were that easy – everyone would be rich.
The figure below for YHOO shows another example, this time the stock didn’t go to extremes before the transition occurred. Also the effect was more rapid. Note that you have to be ready for the “buy-me” and “sell-me” prints because they can occur soon after the transition. On the “sell-me” side the stock was hurried along by a bad earnings report among other bad earnings reports (2Q 2006).

The figures are screen caps from a wonderful on-line software program provided by stockfetcher.com. Stockfetcher is for the sophisticated user who wants to “roll his own” or for the user who wants a set of canned filters using all of the most modern TA methods. They provide a free, try me capability. Warning - don’t try it or you will want to subscribe to it.
I like using the LRS in two ways. First I use the bands on each side of the LRS itself as a trading zone. For that reason I use a 45-period LRS. I’ve noted that stocks that close on the bottom line are prime candidates for rebound. I’ll discuss this method in more detail in another post. Today I want to talk about the LRS transition method.
Obviously because the linear regression method outputs a “slope” that slope can be either positive or negative or neutral. I’ve noticed that when the slope transitions from positive to negative a window opens for a little while for the stock to go up (and vice versa from negative to positive). The figure below of COCO shows this effect.
For Longs:
1. Linear Regression Slope (45 periods) transitions from positive to negative.
2. RSI(14) is in oversold territory
3. Stochastic RSI(14) is in oversold territory
4. Several periods later the stock prints a “buy-me” pattern.
Note that the stock is at the lower band of the LRS. This doesn’t necessarily happen.
For Shorts:
5. The LRS transitions from negative to positive
6. RSI(14) is in overbought territory
7. Stochastic RSI(14) is in overbought territory
8. Several periods later the stock prints a “sell-me” pattern.
Just prior to the transition the stock’s high touched the upper band of the LRS. Again this is not a necessary factor in the method.
While this doesn’t seem incredibly intuitive (a negative going slope signaling a positive going stock and vice versa) most TA is based on extremes within the confines of the stock’s normal price excursion or variances from the norm and not on direct cause and effect. Think about it for awhile and you would agree – if it were that easy – everyone would be rich.
The figure below for YHOO shows another example, this time the stock didn’t go to extremes before the transition occurred. Also the effect was more rapid. Note that you have to be ready for the “buy-me” and “sell-me” prints because they can occur soon after the transition. On the “sell-me” side the stock was hurried along by a bad earnings report among other bad earnings reports (2Q 2006).
The figures are screen caps from a wonderful on-line software program provided by stockfetcher.com. Stockfetcher is for the sophisticated user who wants to “roll his own” or for the user who wants a set of canned filters using all of the most modern TA methods. They provide a free, try me capability. Warning - don’t try it or you will want to subscribe to it.
Friday, July 21, 2006
Friday
Took another look at SWY and decided to let the market stop me out for a good profit. If the market had been rising I would have held it but given the choppy nature of things I decided that a bird in the hand was worth more than the potential for eggs downstream - or something like that. Anyway I got 2.95 out of the trade per share purchased and I'm not going to sneeze at that or cry about it.
Played a little scalp using HANS. The way that works is I watch the VIX and if it starts to fall I try to grab up some high volatile stock such as HANS around a pivot point and ride it to the next pivot point - which is what I did. Made some on it and let the market stop me out. This is a fun way to make a living as long as the trade goes your way. I always keep a tight stop on the play and make sure I dump out at the next pivot point (unless, of course, the market is starting to run up).
Dumped SDS and I don't think these are very good funds to own. It was supposed to deliver 2x against the loss in SPY and it wasn't even close. Best I saw all week was 1.5. Anyway I took a small loss on it but I only had a small number of shares.
Sold back half my BGO - I'm getting a little leery of gold. Given the state of the mid-East I expected gold to rocket and it is doing nothing. So I sold back half today and will get rid of the rest next week if it doesn't rally over the weekend.
Bought INTC - again - I just can't pass it at this cheap a price and I don't think it will go down much more from here. Regardless of the state of the PC market, Intell chips are used in everything else so worse thing probable is that they just sit around my buy price for the next forever. My target is 18 and change or next Tuesday noon whichever comes first. (That's only part joke).
To finish the day I bought Expedia (EXPE). I bought it using a filter that I call linear regression transition. I found that when the linear regression slope transitions from positive going to negative going there exists a short term window of opportunity for the stock to go up. EXPE met that criteria.
The market is drying up (volume is going going gone) while I am typing this (12:18 P.M.) and I think I'm going to pull the plug for the week. All told I made money this week and will probably make more next so I'm happy.
Thursday, July 20, 2006
Thursday
As expected the market gapped up and then drifted down through the day. I sold HLTH and XING this morning before 10:30 and made a small profit on both but not what I wanted. I kept the BGO, SDS and SWY. SWY gained $2.25 through the day and that means it is staying on track. SDS recovered some from the SPY decline and I think they will continue to go down tomorrow and I'll get it all back and then some.
The three sisters finished in the red again and that bodes ill for tomorrow. The up/down percentage is 25% up for the day which is a serious turn-around from yesterday's 75%. I think it will probably go down again tomorrow.
The three sisters finished in the red again and that bodes ill for tomorrow. The up/down percentage is 25% up for the day which is a serious turn-around from yesterday's 75%. I think it will probably go down again tomorrow.
Pre-Thursday
A little skittish after yesterday's bear market rally. A couple of things that bode ill for today.
First the number of up issues from yesterday is over 75% - the last time we saw that on 29 June the market went down the next day. Not large but down. The one big difference between then and now is the VIX. The the VIX was 22% above its 10-day average (an extreme reading that suggests market will be going up in the next several days which it did) now it is the 10-day average. That makes it somewhat neutral as a predictor.
Bottom line - I wouldn't be surprised to see an immediate jump up (futures are supporting this amazing suggestion) and then a fade away day from there.
I could be wrong - always remember rule 1 - nobody knows nothing.
My trading plan is clear - if the market says hold I will hold otherwise I will sell HLTH and XING. I will hold SWY until the pivot point turns against me, BGO and SDS.
Wednesday, July 19, 2006
Buying Safeway
I bought Safeway (SWY) as a result of seeing that it was about to cross over its pivot point and its average close would soon follow. This is not a recommendation only something that I do to inform my trades. I like using averages because I don't mind missing an early entry and they keep me out of a lot of whipsaws. As you can see in the chart I bought it right at the point where it crossed its own average and one day before the close crossed the pivot. I will hold it until it crosses again.
Subscribe to:
Posts (Atom)
