Showing posts with label day trading. Show all posts

Thursday, May 17, 2007

A Good Day Trade Method

I've always liked the counter trade where the stock opens and then begins dropping and then reverses. For years I played this based on tweezer bottoms, 15-minute BOB's and other indicators - many of which were good, some not so good. But the best way that I have found to play the counter trade is with pivot points.

Here is BGG as an example


At 11 A.M. BGG dropped through the S1 point (green on my display) after bouncing off of it twice before (15-minute charts). As far as I'm concerned it is a high probability point to buy off the 11 A.M. candle just as it transitions to the 11:15 candle and set your stop just below the 11 A.M. candle's low. At 12 A.M. it met resistance at the day's pivot point but based on the thrusting action ahead of this I I decided to keep it and see what happened next. This could also be considered a Return to 4 move which it turned out to be. Once more it went back through the pivot point and finally hit R1. At R1 you got a decisive move down at 14:00 and that would have been a great time to exit this trade. Actually there is no fault in exiting when the stock breaches R1 at 13:15 because the move would be exhausted by that time.

One thing that you might want to do is to examine this chart in the context of the candle's body and the EMA 4. One of the reasons that I use EMA 4 is that it seems to act as an immediate attractor for the stock price. And when the candle's body leaves contact with the EMA 4 either high or low there is almost an immediate attempt by the price to reestablish contact. Now I'm not suggesting that all of the trader's in the stock follow the EMA 4 - they don't but what I am suggesting is that stocks become locally oversold or overbought and the EMA 4 seems to monitor that condition.

The end of the day saw the stock go into an interesting situation - a pivot retest, a crossover, and a tweezer bottom coming off an RSI(2) < 2 all at once. Had this occurred earlier in the day it might have been actionable but I never carry over 15-minute charts from one day to the next.

Sunday, March 25, 2007

Day Trade Shorting Is Easy

The shorting I was talking about in the earlier post was for swing trading or even long term trading - that is extremely difficult unless you get something like CMGI at 160 for example and manage to short it in Jan 2000. Then you start believing that you are a genius when actually all you are is incredibly lucky.

But for day trading - pick a hundred stocks, any hundred stocks, put them on a set of 15 minute charts and look for one thing - reverse crossovers - here are three examples -


Note from the examples that you can sometimes catch a stock in a slide (KNOT), sometimes carrying one overnight yields even greater dividends (JBL) but most often it's a one day fling sell and cover.

A couple of rules - pick stocks with a large float so that you can be sure to get the shares you need for shorting. Don't be greedy. Pick targets and when you make targets exit. Watch for pauses - before a stock changes direction it stops - when it stops going down set a close stop in case it decides to reverse direction. See how BSX began behaving around 12 P.M. for an example. Also - on BSX - those two candles pulling back to the 4 EMA at 10:45 are the shortists version of Return to 4. Don't let that scare you.

Other than that you're on your own - good luck - and, this is not an invitation to speculate on the dark side - if you lose your butt you didn't learn it here.

Saturday, March 24, 2007

Using BOB as a Day Trade Starter

When I began day trading one of the more difficult problems to solve was finding stocks to trade. I used gap-up and gap-down screens right after market open and these work well but sometimes some of the best trades are neither gap up or gap down.

So I think that that I have solved that problem for good by using the BOB set-up filter to find potential day trades. And had I been at my station Friday instead of beating a white ball around I would have had a beauty – IN.

The BOB set-up filter finds the first two candles of the set-up and then relies on you to find the third candle.

Here is how IN looked on Thursday with the BOB set-up – you can see how the set-up converted to a full BOB on Friday – it opened and went up – i.e. the low of the day Friday was above the low of Thursday. And that is key and critical to a BOB set-up.


The 15-minute chart looked like this so if you didn’t want to take the crossover entry off the BOB set-up you could have taken one of the returns to 4.


Here is how those looked with the pivot points in place. I used the extended pivot points to illustrate this trade.


This chart also has a couple of other interesting features – one is the dummy spot on Thursday coupled with the RSI(2) < 2 and the other, not annotated, is the last three 15-minute candles on Thursday have a BOB, an RSI(2) < 2 and a tweezer bottom all in the same three candle set-up. I never recommend starting a day trade overnight on something like that but it would have lent credence to the next day’s action. And as soon as you saw the crossover you could have taken the trade with confidence.

Wednesday, March 07, 2007

Day Trading with the Pivots

This post is going to knock off a couple of questions that some readers have posed.

Question 1 - Do you find the Pivot Points contained in Quotetracker to be useless relative to stocks whose opening price gaps-up? Short answer - no - I've used pivot points for a number of years (although I've gotten better with them in the past year than I was before - practice practice practice) and have no issues with the ones generated by Quote Tracker even on a gap-up stock. There are two ways to play gap-ups with pivots - first - wait for the stock to return to the pivot point (i.e. close the gap) and play from there on the rebound or second - play between R1 and R2 or mid-point high (which you can estimate using the EMA 4 or 8). If a stock gaps much beyond R2 I generally don't play it because I've learned that most of those have already blown it for the day.

Question 2 - Have you ever tried Camarilla Pivots? Are they any better/worse than normal pivots? My quick answer was I hadn't but I would look into them. The two figures below show some of the variances using a real trade that I took this morning.

I was out at the open at an appointment and didn't get back to the screens until about 11 A.M. I got my initial screens set-up and the NFI chart came up because I was using it to demonstrate something for Dogwood. I noticed that the price was coming back to the pivot point (I had it on a 4-minute frequency - I changed it to make it less cluttered for this demo). I said to myself - if it bounces off the pivot I'll take a trade - it did and I did. A little before 1 P.M. I closed the trade - right after it went over the R1.


Ordinarily I wouldn't have taken this trade except that it was there and I didn't have anything else set-up at the time. As it turns out I didn't have to sell it off when I did - it went back up through R3 and in fact I expected it too - but I had planned to sell it at that time and so I took the profit and ran. So that's a good example of how to play the pivots on a gap-up. You wait till it hits resistance and comes back. As far as gap-ups coming back - they don't always do they just mostly do. We call those Return to 4 or Return to 8. This one went a bit farther than that but you can see that the EMAs 4 and 8 are both about mid-way between pivot and R1. Imagine that - I don't make this stuff up folks - I really trade.

Here is how this trade looks using Camarilla pivots.


You can see the variances - first the pivot point is exactly the same - but H3 is just 4 cents away (on this chart - sometimes you can't even find it). But the variance between pivot point and H4 is closer than the normal pivot point and R1. I find that consistently from chart to chart and I don't like it. Here is why - most traders who are using pivot points are using the same old fashioned sets that I am - therefore they are watching the same old targets that I am. You should too - that's where the action is.

Now it could be that Quote Tracker doesn't have a correct formula for converting to Camarilla pivots but I doubt that. Either way I think I'm going to stick with what I know and understand - it seems to work - don't you think?

Thanks to Habben - he gave me a reference to Woodies club - and I guess the inventor of Woodies pivots is now making a living teaching others to trade - and that's good for him.

Tuesday, February 06, 2007

Return To 4

I haven't talked about a gap-up trade in quite some time - mostly because I prefer the counter trade (I like the stock to know where it's going). But I was doing some practice earlier and ran across this beauty and thought I'd take a minute and share it with you.


This is the classic gap-up return to 4 that Trader X invented and then chose to share with everyone for free quite awhile ago (actually X uses the MA 5 but I've modified it to an EMA 4 - same effect - I just prefer the EMA).

There are multiple theories as to where to take this trade and when to end it. If you go to X's site you will get his version which is extremely good and very safe. If you stay here you'll get my version which might or might not appeal to you but it will be a little different.

I have three theories of entry as shown on the chart. When given this type of set-up I will always take entry 1 at the EMA 4. The little dummy spot in the fifth candle position helps make the determination in this example. A more conservative approach will be to wait for entry point 2 and the most conservative, highest probability approach is to wait for entry point 3.

The box drawn above the entry possibilities is labeled "Echo" - that is an echo effect that you get many times. It is actually the stock pulling back in to the EMA 8 which is the reason why I keep the 8 on the chart. If the stock closes below the EMA 8 it is probably done going up (not necessarily but probably). If not I will hold it for a bit more and let the candlesticks determine the selling point. In this example that would have been at 2:15 because the large candle coupled with elevated volume generally signals an end to the run. The following two candles push me out if I didn't get the first memo.

Trader X uses Fibonacci lines to determine his exit point and you probably will want to read up on those as well. Once more a personal preference but I'm more comfortable reading the sticks.

Thursday, January 25, 2007

Thursday's Wrap

Well I mis-called that one. The indicators all pointed solidly down and the market followed the indicators. After my epiphany this morning regarding EBAY's profits I was not surprised. I'm working on a new indicator that looks like it might be better than the old up/down ratio - I have to watch it for awhile and if it proves to be valid I'll include it in the mix.

Bought some KKD just above midpoint low (MPL) and it didn't do anything all day except bounce around the MPL. I'm holding it overnight because the indicators are all solidly up for tomorrow and this time I'll follow the indicators. We'll get to those presently.

One that I missed was BKUNA - I had it on my daily watch list and for some reason or other didn't believe what I was seeing. But it came out of S2 this morning like a shot and went to R1 at the close - my mistake. Here is what that looked like.


You see how you can combine your process (wait for a bottom indicator) with the pivot points in order to make decisions. This one was pretty clear and I really don't know why I missed it except maybe I dozed off for a bit when it was developing.

Day 7 and the dumb traders started shorting GOOG again. Don't they know that Jimmy called for a short squeeze? But in all seriousness - at least as serious as one can be in this business there are some interesting developments in GOOGle-land. One of the sites I frequent, whispernumber.com, is suggesting that the "whisper number" is lower than the analyst estimate for GOOG - by 6 cents. Now we know what kind of havoc 4 cents can bring. If the whisper number (the non-publicised but hardly a secret number) turns out to be correct - look out below on January 31st.

OIH was off again today - some market some inventory a lot of hot air - most of it on the East Coast of the USA. Have no fear oil bulls - summer is coming and I can pretty much guarantee we are going to need a lot of air conditioning and all these old oil fired electric plants are going to be working overtime supplying the juice.

Seeing some chatter about the housing market depression being over and I really think it is. The reason why is because the other day in my morning paper (yes I still get a newspaper - how living in the 50's is that?) in the primary spot (upper right front page) big headline regarding the slump in the housing market. I contend that by the time reality reaches the mainstream media change is already underway. Barry Ritholz disagrees but he said we having a lousy Christmas season and we didn't. Remember rule 1 - nobody knows nothing - including me - and especially in this case since I agreed with Barry.

The up/down ratio is rock bottom at 24% which is more than half of yesterday. The new 20-day high/low ratio is at 39% which is also more than half of yesterday's number. The VIX actually leaped over its 10 day moving average and is now in the yellow zone of oversold territory (+5 - 10%). The DIA, Q'S and IWM all printed white candles in the last hour. GS printed a dummy spot (Doji) and SPY printed a gravestone Doji. Everything signals a bottom. So I'm forecasting an up day tomorrow.

The magic coin having listened to all of the evidence says ... heads - agrees with me.

Marlyn is now 7-5 and 1 and the coin is 5-7 and 1. See you tomorrow.

Tuesday, December 19, 2006

Tuesday Wraps

I’m still holding SYMC and WFC and both actually went up today. I managed to salvage most of my losses on ORCL this morning – I expected a small downside – not that steep drop but, as always with a mature company, the first drop is an overshoot and if you jump on board and double or triple up you can usually get out without losing your shirt – and that’s what I did. I wouldn’t do that for some no-name but I seldom play immature companies just for that reason – I really want to know how the trading community reacts to bad news or, as in this case, good news.

I jumped out on the rebound at .25 and only lost a 100 bucks in all. Considering I was a grand down at the start – not bad. I then took a solemn vow – I will never play ORCL again – this is the second time that it was traded out from under me for no good reason. It is now on my white board under the word “Never” along with 20 or 30 others that I will not play - mostly because they are empty pieces of junk that misbehave.

(start sermon)
Warning! Warning! Warning! If you try this on your next dump job and you lose don't blame me - it is not an approved method of trading. Never, never, never double up a losing position - Never! (end sermon)

In case you think I have forgotten my day trading skills I took a small position in MAMA off a new method that I have been testing. It seems to work but I’m going to tell you that the risk factor is high and you need to move quickly. I have found this to be an effective play in every time frame from 4 minutes through 15. Look at the chart below.


You can see what the new set-up is – if the first time increment encompasses all three of the EMA’s that I use then I buy it on the next open. I keep my mental stop at the EMA 21. Now I don’t know if this will work with other moving averages because I’m happy with it working with the three I use all the time. Interestingly, MAMA also had a classic set-up a bit later in the morning – but I was already in the trade.

If you don’t think this occurs very often – take a look here at WFC – also today.


And here is a counter-gap trade I wish I could have taken but I was back on the shopping detail this afternoon. I give you HANS.


Finally – I thought the markets had a good chance to go up today because the first hour PC ratio opened above yesterday’s first hour open and closed below yesterday’s first hour close. That was despite the fact that the FTSI 100 was down all day. As I mentioned yesterday - these are rules of thumb and not hard and fast "must be's".

Of course a lot of stocks did go up today – the up/down ratio is back at 45% but the new 20 day lows are still 200 more than the new 20 day highs and that is a good thing. The VIX is back at 5% below its 10 day moving average but the good news is that every major index we follow and GS finished the last hour with a strong red candle – there was a ton of selling going on. All of this leads me to believe that we will probably go up tomorrow. But as you know a good trader doesn’t care about the direction of the market because a good trader can make money regardless.

I’m giving Mr. Magic a pass for today since the market finished mixed which leaves him at 37 – 29. For tomorrow --- tails – bear in the air - - oh, who believes in magic anyway?

Wednesday, December 06, 2006

Wrapping Wednesday

Took HANS today as soon as it broke yesterday's high which was the last tick yesterday. Made a buck and change on it and am very happy. Also played AFFX but that turned into an investment - it was only up about 20 cents all day from where I bought it and I decided to hold it overnight. I'm OK with this because I believe that the market is going up tomorrow based on the internals that I watch. More about that later.

I took AFFX as a result of something I saw on the 2-hour charts using a new theory that I'm working on. I'm not ready to divulge it yet because I think I might have just got lucky but if it pans out I'll share it with you. Yesterday, if you recall I mentioned that I would be watching AFFX, CTXS, and BRCM today. Of course I won't play a stock unless there is a viable set-up.

I played AFFX off a gap down set-up. As I mentioned it went up about 20 cents from where I played it. Had I picked up BRCM from its gap down set-up I would have made a little more. CTXS didn't set-up until late in the day and by that time I was busy with other things. So all three stocks set-up and all three went up from their set-ups on an overall down day but I want to make sure of my proposition before I share it with you. It might take a while because I don't like rushing these things. In the meantime if you look at the 2-hour charts on your own and figure it out for yourself - even better for you since it will be like you are discovering it on your own and that's not a bad thing.

For tomorrow, using the same approach, I'll be watching ATHR, SYMC, PTEN,and CRM for playable set-ups. As well as trying to find a spot to unload AFFX.

For tomorrow the up/down ratio is printing 41% which is nearly oversold territory, the new 20 day highs pulled back by a third to 724 and the new 20 day lows increased by 10% to 178. The three sisters and the proxy for the 22nd century all printed very strong white candles and only IWM printed red in the final hour. Put it all together and I see an up market tomorrow.

The magic coin has fallen on hard times having fallen to 33 and 26 because it missed today too. For tomorrow --- tails - bear market - I doubt it but, we'll see.

Tuesday, December 05, 2006

Tuesday Wrap Up

Dumped SYMC 5 minutes into the session and glad I was to do so. Picked up some AMD and got out a little ahead of commissions - it was up to a reasonable profit but I let it degrade into nearly a break even trade. A couple of old favorites such as HANS, GM, and AMR made some today - but I picked AMD as the trade of the day and that's the way of this game. You make your pick, you buy the assets, and you take what you get. But AMD is officially off my Christmas list.

This is nonsense - the market goes up for an hour and then degrades the rest of the day. I'll give you an idea - by 10:15 the DIA was up 25 cents to 123.22 - it closed at 123.35. Made 25 cents in 45 minutes and took another 6 hours to make an extra 13 cents. And it never really was much higher than that just another nickle. Can't make any money in this kind of environment. I'm considering going back to my old method which was strictly overnight - buy at 3:45 sell at 9:45. In that half hour you will make more money than at any other time in the market. So sayeth brother Brett (Dr. Steenbarger) and so sayeth Marlyn. But it takes real guts to hold overnight in this environment - so if you don't have the stones don't make the play.

Currently flat and happy - always be tomorrow. For tomorrow, although I think it is going to be a down day (but I think that almost every day and am wrong quite frequently) I will be watching BRCM, CTXS and AFFX. If the method I am researching pans out I will let you in on it tomorrow evening.

The up/down ratio prints 49% which is neutral as is the VIX. New 20 day highs did pull back some to 1028 and the new 20 day lows went ahead to 150. These changes are extremely small and meaningless. The three sisters, the ugly step sister and the proxy for the market of the 22nd century, GS, all finished the last hour in the white(green) which is a totally bogus signal as far as I'm concerned.

The problem remains - nothing to buy. To put it into a different perspective right now for stocks between 5 and 250 with an average 90 day volume greater than 500K there are 200 closing at the upper Bollinger Band and only 9 closing at the lower Bollinger Band. Tell me we aren't top heavy. Something has to give and, truthfully, we need a couple of weeks of solid declines. I hope we get them because only then will we be able to get back to making real money again on the day side. Besides the shortists need a break too.

Ol' magic coin is 33 and 25 having missed yet another one but persevering always it bravely soldiers on and for tomorrow says - heads - bull market. I think we can fade that.

Monday, December 04, 2006

Why Can't I Make Money In This Market

Well not me - actually you - I've cut back on my trading because of some things I don't like about the dynamics of the market and the time of year. But the last 4 or 5 months have seen some record gains in at least one index and for the rest of us some mediocre, at best, profits. My reader (thanks Mom) wants to know why.

The best excuse I can come up with is that we are dumbass day traders and had we simply invested (yes, Virginia, I said "invested") our fund (only rich people have "funds" most of the rest of us just have "fund") in the Q's back on July 26th we would have seen this happen.


And we would be living happily ever after. (Note how I cleverly pointed out a blow-off bottom way back then - yes, you even get them on the daily charts). We would have went from 36 and change to 44 and change and could have had a huge party.

Instead we tried to pick at the market and find places where we could make a quick buck and what we were fighting against was this -


Or chop-chop-chop for most of the time since the run-up began. Chop does two things to you - first it destroys your confidence and second it destroys your trading account.

I read this chart this way - for about the first 20 days of the run it was a long's delight because the market continued up unabated. This period, of course, was the rebound from the previous declining period - a rebound is generally robust. Then we went through about 50 days or so of chop. This was followed by a second period of smooth running and then a relatively easy time for the shortists over the past week or so.

The biggest problem with chop is that volatility disappears. It doesn't just get low it becomes non-existant. If you get the same volatility reading within a couple of cents every day for weeks on end that means that there is no volatility. I.E. nothing is moving. But actually what it means is that while some things are zigging - enough other things are zagging so that volatility remains benign. I attribute this to the 8500+ funds that currently prowl the market using automated technology looking for every sign of weakness both long and short.

Here is what volatility looks like during a period of chop. This is the VXN which is more or less the same as the VIX but since it relates directly to the NASDAQ I thought it would be more appropriate for use here.


You can see that at the beginning of the 6 month run there was a lot of volatility, that damped off to just about nothing during the choppy period but recently it started moving again. One other thing that you can see in this chart is how volatility moves somewhat contrary to the market. This goes back to Bollinger's statement that low volatility begets high volatility and vice versa. It is obvious what he was talking about when you look at the figure.

I believe that volatility is the real reason that we have been struggling lately - the lack of any meaningful volatility means the market wasn't moving very much. Hopefully with its apparent return we will see some market movement that will be meaningful to our trading accounts.

Monday, November 13, 2006

Monday Wraps

It was over about 45 minutes into the day the market stopped, went into idle mode and stayed there pretty much the rest of the day. These are not good days for traders unless you happen to find some great pick and ride it for awhile and I didn't. I took a position in CTXS and although it was profitable at the end of the day I decided to hold it overnight and may even go with it as a swing trade for a bit. We'll see. As long as the market keeps doing this (and it has been doing it more often than not) I may just go back to buying at 3:45 and selling at 9:45 the next day - seems as if the only way you get any momentum at all is overnight. Once the market opens everything gaps up and then slides the rest of the day.

Anyway for tomorrow another mixed bag - the up/down ratio sits at 49% or neutral, the VIX remains in neutral, the new 20 day highs pulled back a bit but stayed over 600 and the new 20 day lows add 1 to print 292. The three sisters, the ugly step sister and the proxy for the market of the 22nd century, GS, all finished with a red last hour. I'm beginning to think that that is a good thing.

The magic coin goes up one to 29 and 16 and for tomorrow - heads - another bull day - probably so.

Saturday, November 04, 2006

90% Of All Technical Analysis

Is unmitigated crap and the other 10% is just humbug. In other words it just isn't what it purports to be. The only thing you need is a stock with some momentum, a couple of exponential moving averages and candlestick representations of price. And it doesn't matter what time frame you trade in.

If you take the time to analyze the indicators that you use you will see that they are not telling you anything that you don't already know. The reason I use the exponential averages however is that I have found them to be wonderful predictors of what other traders will probably do. Only "probably" because we can't ever know for sure what the other several thousand people looking at this particular stock are going to do - or can we?

Friday 10 3 2006 - a particularly nasty day for longs and shorts believe it or not. Just because a market is going down doesn't mean that the stock you are in is. In fact it might have blown all of its downward momentum early and is now looking for a bid.

Anyway here is what you should be watching - the Q's - and if you happened to have had them up on a 4 minute chart with the 4, 8 and 21 EMA's here is what you would have seen...


The Q's were basing begining about 11:20 or so. Now you wouldn't have known that until around 1 P.M. but seeing this pattern of prices with the 4 and the 8 EMA's intertwining tells you that traders are buying. Not just that selling has stopped but that buying is taking place with any selling that is going on. Just before 1 P.M. we had another attempt at a blow out bottom. I say another attempt because between 11:20 and then there were at least 3 others. Could be a false alarm - watch for awhile. At 1:22 or there abouts the price rises out of the consolidation basing area and crosses the 21 EMA. That is a clear cut signal that more buying is happening than selling. Quickly you switch to your watch lists and find --- NTRI --- and look what else you see...


A couple of attempts to break out and then a tall white candle crossing the 21 EMA. See how the 4 and 8 EMA's had been intertwining - this suggests that someone was buying every offer and then some. The break out came 2 minutes after the Q's broke out - isn't that amazing. Now all we have to do is watch for a clear cut exit that came a little before COB. There was a blow out top - this is recognized by the fact that the price is running away from the 21 EMA. When that happens the 21 EMA acts as an attractor and pulls it back again. I would wait for two elements of confirmation which came quickly in the next 8 minutes and then sell - sell - sell.

And that is how you make a buck and change on a bad day without using technical analysis. Notice how I never mentioned ROC, MACD or Bollinger Bands - not once.

Oh one more thing - why do I use "4-minute charts"? Because most traders use 5- minute charts and I want to be one minute ahead of them. (That's a 20% advantage).

Thursday, November 02, 2006

Wrapping Thursday

Missed most of today - thank God - but did play AMD for a brief time this morning - lost a dime and HANS for an hour or so and made 50 cents. I played AMD off a two white candle formation and it went one more increment and I thought, based on shaky price action, that I should sell it then but didn't - consequently the dime loss. HANS I played off the white hammer in the first 15 minute candle. The next candle was a red spinning top which generally means wait a minute I'm thinking and this was then followed by a white candle where I took the trade. I was out about the high of the day but I didn't know that until this afternoon when I returned to the office.

Tomorrow is shaping up to be an up day - the three sisters all finished with white candles in the last hour and the VIX is back in neutral territory. The up/down ratio still stays bullish at 36% and the new 20 day highs lost some more to 333 but the new 20 day lows put on over a 100 to 715. The last time the new 20 day lows were over 700 was over 60 days and 10 SPY points ago. Another thing is that the end of the month checks will have been in the process for over 3 days which means that they are now cleared for investment purposes and the funds can start buying everything in sight.

Magic coin is 26 and 12 having nailed today even though it wasn't so much a bear day as a pause. But I'll give him his due and put another in his win column. For tomorrow he says - heads - the bull is back - I agree.

I'll be back tomorrow morning with another screen shot of the IWM and friends and we will see what Marlyn's Curve thinks about all of this.

Wednesday, November 01, 2006

Wednesday Wraps Dallas

As I wrote this morning - Wednesday morning coming down. I played HANS and made some on it off a dip caused by Cramer bless his heart. He isn't the sharpest tool in the chest but he sure is entertaining.

It was an old fashioned "what is this stock doing way down here" buy and it worked out. The morning of course was a whole lot different from the afternoon which turned out to be a shortists wet dream.

Tomorrow is simple enough up - up - and away. Why? The up/down ratio is 29%; for the first time in over 29 days the new 20 day lows out number the new 20 day highs (585 to 357); and the VIX is actually 5% greater than its 10 day moving average. All three sisters finished in the white in the last hour of trading. There is nothing more to say - there are stocks to buy and the money is going to be coming in from the IRA and 401K crowd.

Mr. Majestic is 25 and 12 having nailed today perfectly and for tomorrow ... tails again - I can not agree.

Tuesday, October 31, 2006

Good Tuesday Morning

It looks like I got the bounce I was looking for on SAI which is good and now I can close the book on Monday with a nice profit instead of a loss. But that's not what I'm here to talk about - instead I want to talk about the value of reading BLOGs - there isn't much. Some are humorous and some are informative and some are both and manage to stay that way. I don't know what this one is but I think it might be a bit of all the above at least I hope so. I mean I'm the only one with a magic coin (that was right about today by the way) so that is something.

But I have had to cut them back again - amazing how I keep cutting back over and over again. The fact is you can read BLOGs all day long and not get anything else done and at the end of the day feel as if you accomplished something but in reality all you did was read other people's BLOGs all day long and you probably don't even have a new idea to show for the effort.

Worse yet you might even be tempted to comment on what someone has written and next thing you know you are involved in a discussion with people whom you probably wouldn't give the time of day to if you met them on the street - well maybe you would do that but you certainly wouldn't give them financial advice nor take any from them.

Even worse than that is you might get involved in a trading chat room and wind up giving buy and sell advice on individual stocks to people who don't know you from Adam's house cat and worse yet they might even take your advice - even though sometimes it is pretty good you must always remember the first rule - nay I say unto you the PRIME DIRECTIVE - nobody knows nothing - including me!!!!

Not that I've caused any harm - yet - and that is a powerful word "yet" so I'm quitting getting involved in other folks BLOGs while I'm still ahead. That will give me more time for my own and maybe I can keep it fun and new and current.

See you later with news of the day.

Monday, October 30, 2006

Monday Wraps It

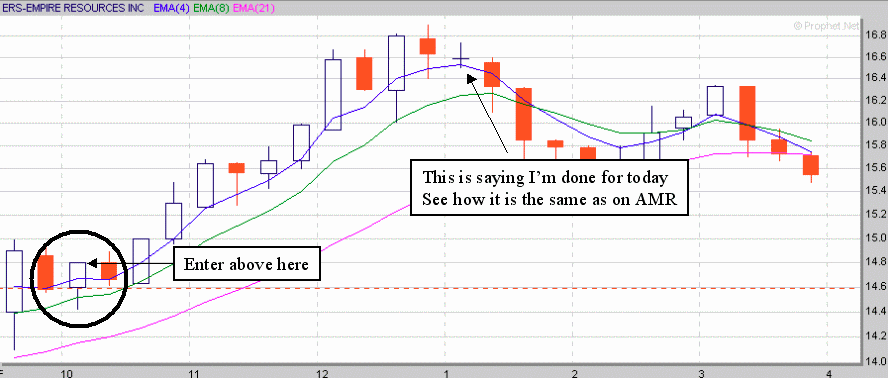
Left out the "Sh" in the title - you figure out where it goes. Lost 187 bucks today because I took some dumbass trades. First I managed to dump ISIL which I was holding from Friday for a small profit. Then I grabbed onto some ERS because I figured it was going up - it didn't it went down and I lost about 400 on the exchange because I was too dumb to either hold it or get rid of it sooner. If I had held it I would have made a couple of beans - eventually. But I panicked - so much for disciplined trading. Then I picked up some SAI - based on you ask - nothing says I except I thought it was going up. It did and I didn't sell it so now I am holding it over night. I expect a big day tomorrow - end of month markup and a gap up first thing in the morning - at which point I will sell it. If no gap up then I will probably hold it.

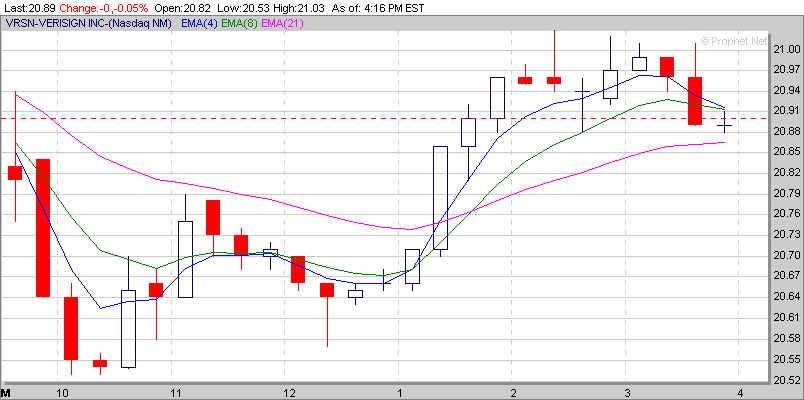
Then I bought some VRSN - this time off a hammer formation with a confirmation - look at the 12:30 candle and the 1 P.M. candle - that's where I bought it - I sold at the 2:45 candle.


Along the way I also bought RIO on a hammer formation but this one failed and I sold it at a 2 cent loss. Almost a break even trade.

All in all what an absolute crap day - 5 stocks 2 wins, one even, one loss (big one) and a holder. Hopefully the holder, SAI, will bounce enough tomorrow to get me even with the board.

In the midst of all of this crap trading I missed AMR and CTXS both of which set up nicely right out of the box and would have provided a healthy return. Oh me oh my - that's what happens when you start looking around for something new. You never know what you got till it's gone - you take paradise ... oh never mind.

For tomorrow I envision an up day - the up/down ratio remains in neutral (45%) and the VIX is also neutral. Two of the three sisters finished in the red but barely and the Q's finished strong. The 20 day new highs added a 100 but the lows only dropped 14. These are all good things for an up day tomorrow - at least tomorrow morning which is all I really care about.

I'm going to leave the coin with 24 and 12 since today was mixed and there is no way the coin can land on the edge - for tomorrow - heads - bull run coming.

Sunday, October 29, 2006

Hammer Entry - More Examples

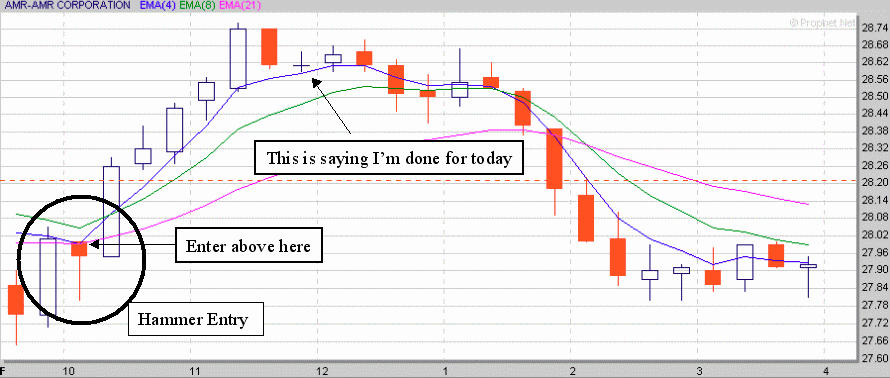
Here are four hammer plays – note how they all appear alike in the entry but we have four different exit clues.

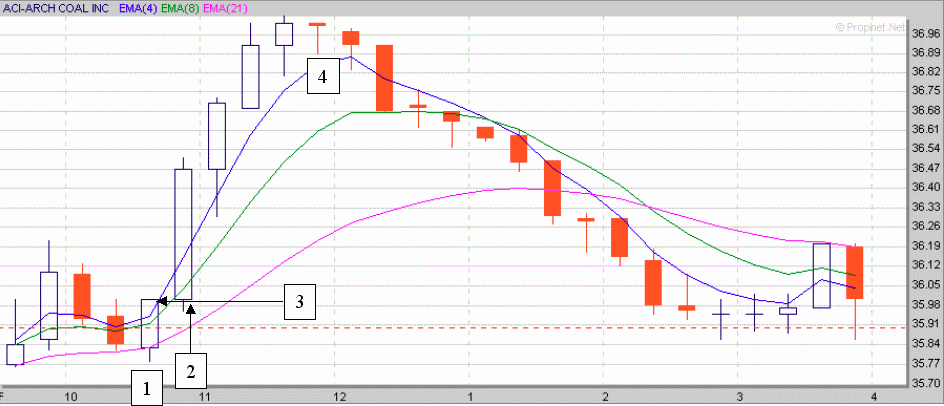
ACI – first the energy sector was going up on this date so ACI was a natural for a play – the coal industry normally participates in the energy rallies. This is a standard white-hammer indicator (1). The next bar in the sequence opened at the close of the white hammer and then descended. It then rallied (2) and the buy point is when the price exceeds the high of the hammer (3). The sell point is at 4 where we see two lower highs.


RIO – a steel play the hammer is only hammer-like but close enough to serve as an entry indicator. The next bar in the sequence opened at the high of the hammer and then descended. It then rallied (2) and the buy point is when the price exceeds the close of the white hammer (3). The sell point is at 4 where we see a twin-peaks top (two highs exactly the same). The twin peaks is generally a good exit point.


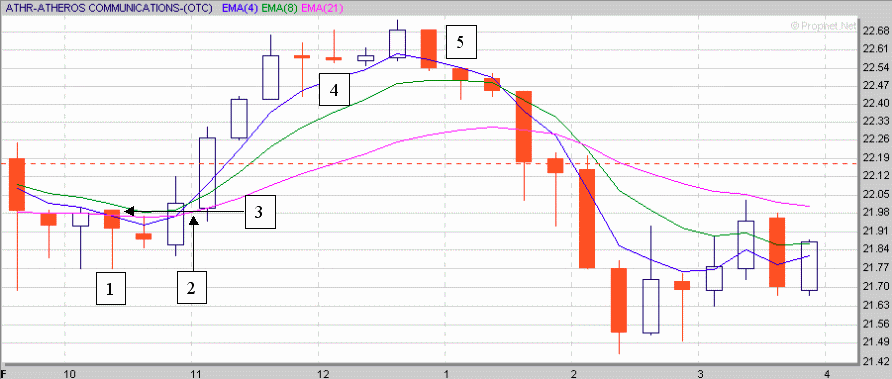
ATHR – a telecom play has three hammers in a row and any one of them could have been used for an entry indicator because we will only enter when we get the confirmation where the price exceeds the close of the red hammer. Therefore using the 4th bar as the entry point we wait until a price exceeds that close (3). The exit is based on the “steeples” we see developing at 4 and confirmed at 5. Sometimes when the price gets away from the 8 period EMA it begins to walk sideways back to it. That’s what we might be seeing in bars 10 and 11. But the confirmation comes at 5 and that says – exit now.


PETM - an Internet play – this is a good one in that it does this often. This is a red hammer entry (1) at bar 6. The next bar in the sequence opened at the close of the red hammer and then descended. It then rallied (2) and the buy point is when the price exceeds the close of the red hammer (3). The exit (4) is the large steeple at bar 12. I generally use this upside down hammer (or hanging man) as my clue to exit. Note that the 11th bar on ATHR is also a hanging man.


All of the charts come from prophet.net - an excellent site.

Saturday, October 28, 2006

Hammer Entry

A powerful entry point is after the "hammer" formation in either white (green) or red. The hammer is formed when the price declines and then comes back up - this leaves a longish tail and a flat top. Some people don't like to use the red hammer for the entry but I do. Here are three examples from Friday October 27th.


Note that the entry point is always higher than the hammer. I use that as a confirmation point and set my buy stop a couple of cents higher the the top of the hammer. It probably isn't necessary but I like the comfort of the confirmation and am willing to give up a couple of cents for it. If I set a stop it would be at the bottom of the hammer body or 10 cents whichever is greater.

Friday, October 27, 2006

Friday Wraps

Told ya! - Market went down and down hard - no excuse except nothing left to buy - so it became time for a rotation. I played AMR (what, again? yes, again) and made some early on which I then proceeded to play into ISIL. I decided to hold it over the weekend even though I hated the idea but I do believe that there was nothing wrong with the stock just the day. Of course there was news about their COO quiting or being fired or some such and that was enough of an excuse. I'll probably double up on Monday if I can get in before it shoots past my buy point.

Monday should shape up to be a fine day - end of the month of October is traditionally the start of the up season and I think today was just the prelude to that event. Anyway the up/down ratio is a torrid 30%, the new highs shaved about a thousand to 472 and the new lows hardly moved but went all the way up to 281. These are great numbers. It means the pressure is off but the rally is still intact. The three sisters finished in the white and the VIX remained neutral - pulling back a little more towards its 10 day MA.

The coin, magic my butt, is now 24 and 12 having blown an obvious lay-up today but for Monday it says ... heads - bull market comes - I believe it.

I'll be back later this weekend with some more charts for your viewing pleasure.

Thursday Later Than Usual Wrap

Had some things to do yesterday afternoon gang and by the time I got them done I was plumb tuckered out - but better late than never (or at least I think so).

Took a position in AMR (again, yet again) and it proved profitable but also served to show yet another nifty concept regarding a stock's price - that moves are done in waves. Take a look at this daily 15-minute chart.


You will see this pattern repeated over and over again in both directions. It's why we traders sometimes are crossed up because we are waiting for the third wave and the bottom falls out instead. But if you watch for setups you can see that you can use this wave method to find afternoon plays that are sometimes better than those in the morning.

Friday should be a down day - The up/down ratio has crossed the divide and now sits at 64% while new 20 day highs are at 1422 and lows are printing 159. There is nothing left to buy and this market has to be bone weary and tired regardless of all the good earnings news. And that isn't really that good anyway.

The VIX remains neutral although I don't know how but the fact is a low VIX is not as important as a high one. The three sisters either finished the last hour red or as a topping doji. The three major indices all finished with topping doji as well. She's goin' down I tells ya she's goin' down ... which is not a good thing.

Mr. Magestic ("magestic - majestic + magic" - get it) never mind - the smartass coin is now 24 and 11 having nailed Thursday and for tomorrow says ---- heads - bull market. I'm not going against the coin.