In this one I combined the SMA 200 with the SMA 20 in several variations.
If the Close is:
< 200 > 20 27871
< 200 < 20 4308
> 200 > 20 19994
> 200 < 20 12393
Again this is for 1 trade a day, no more than 4 stocks in the portfolio at any one time, and the holding (swing) period is at least 1 day but no more than 4 days.
The filter requirements are exactly the same as those in Swing Trade - 3.
The obvious winner, again, is when the close is less than the 200 period moving average and less than the 20 day moving average.
If you do decide to use exponential moving averages you are probably going to be a little bit ahead of the average trader - by this I mean the exponential should get you into the trade before the other guy and that is a good thing. It will also get you out before him too and that, sometimes, is even a better thing.
None of these posts are recommendations - do your own due dilligence. Betting, uh, playing, uh, "investing" (wink wink nudge nudge) in the stock market is not as easy as it looks. Trust me - I've got the scars to prove it.
Showing posts with label Exponential Moving Averages. Show all posts
Showing posts with label Exponential Moving Averages. Show all posts
Friday, November 24, 2006

Swing Trade - 3
I combined the EMA 90 with the EMA 21 in several variations. As usual now the results are surprising.
If the Close is:
< 90 > 21 33627
< 90 < 21 8214
> 90 > 21 18888
> 90 < 21 18911
This is for 1 trade a day, no more than 4 stocks in the portfolio at any one time, and the hold (swing) period is at least 1 day but no more than 4 days.
I made one other change to the filter - I took out the requirement for close to be greater than the last close. In other words any stock that meets the moving average requirement and has the highest average volume for that day is the stock that is selected. It doesn't get any simpler than that.
Obviously the best of the four options is when high volume stocks close below the EMA 90 but above the EMA 21. The second best is when they are above the EMA 90 and above the EMA 21. This fits into the pattern suggested by swing trade-2 where the best options were for stocks closing above their EMA 21 and MA 20.
If the Close is:
< 90 > 21 33627
< 90 < 21 8214
> 90 > 21 18888
> 90 < 21 18911
This is for 1 trade a day, no more than 4 stocks in the portfolio at any one time, and the hold (swing) period is at least 1 day but no more than 4 days.
I made one other change to the filter - I took out the requirement for close to be greater than the last close. In other words any stock that meets the moving average requirement and has the highest average volume for that day is the stock that is selected. It doesn't get any simpler than that.
Obviously the best of the four options is when high volume stocks close below the EMA 90 but above the EMA 21. The second best is when they are above the EMA 90 and above the EMA 21. This fits into the pattern suggested by swing trade-2 where the best options were for stocks closing above their EMA 21 and MA 20.
Swing Trading - 2
As promised I looked at some shorter term averages and - wow - that's about all I can say - well I could say some other things but I'm trying to keep this family friendly - if you get my drift.
I used an EMA 21 and an MA 20 - at two different levels of severity - 5% and 8%. The backtesting script remained the same - here are the results -
< EMA 21 5% -144 8% -5721
> EMA 21 7883 855
< MA 20 804 -1067
> MA 20 10754 4676
What this is saying is that being above the short term average is a good thing and that being above the simple 20 period moving average is better than being above the exponential 21 period moving average. That, naturally, is totally different from the findings with the longer term averages.
Wow! Now I have to go and look and see what combining the long and short term averages will do for us. I can hardly wait.
I used an EMA 21 and an MA 20 - at two different levels of severity - 5% and 8%. The backtesting script remained the same - here are the results -
< EMA 21 5% -144 8% -5721
> EMA 21 7883 855
< MA 20 804 -1067
> MA 20 10754 4676
What this is saying is that being above the short term average is a good thing and that being above the simple 20 period moving average is better than being above the exponential 21 period moving average. That, naturally, is totally different from the findings with the longer term averages.
Wow! Now I have to go and look and see what combining the long and short term averages will do for us. I can hardly wait.
Swing Trading
True to the name of the site we have come up with a couple of new filters - this time for picking trades for swing trading. Simplicity is the key to the very best filters and these two are so simple even a caveman ... never mind that's been used already ---
The basic filter is stocks that close between 20 and 59 dollars and are +/-15% of their 90 day EMA where the most recent close finished greater than the previous days close.
Ok - in layman's terms I am trying to garner a list of stocks that are currently either 15% below their EMA 90 or 15% above their EMA 90. This was based on Dr. Brett Steenbarger's column today regarding the moving average and the fact that the SPX shows much better returns when it is below its 200 day moving average than when it is above. I just used an exponential moving average rather than a simple and individual stocks rather than an index.
I backtested the two filters against the same set of conditions most notably only one stock would be played a day (the highest 90 day average volume stock) and only 4 stocks would be held in the portfolio at a time. Using a 100K bankroll that meant that no more than 25K would be played on any given stock. I set my hold period to no more than 4 days or 10% loss or 15% gain or momentum greater than 2 whichever came first.
The envelope please - in both instances a 77 day period was used (ending on 11/22) which meant that 77 stocks were picked. Of the stocks that began greater than the EMA 90 the end result was a loss of 183 dollars. Of the stocks that began less than the EMA 90 the end result was a gain of 29831 dollars. Big difference.
Then, for fun, I switch the EMA to a simple moving average using 200 as the base. The end result this time for the less than 200 day moving average was 26484 dollars - a small difference. However, for the greater than 200 day moving average the result was 11632 dollars - which is a big difference.
But in both instances Dr. Brett's experiment is supported - you should have better returns with stocks starting from below a long term moving average than with those starting from above. That is a result of regression to the mean.
If I have the time over the weekend I'll try this with a couple of other moving averages - specifically the EMA 21 and the MA 20. Needless to say I could get really classy and start combining long and short term averages and if I don't get too confused I might try it.
I used Stockfetcher.com for my filtering and backtesting software. Different date ranges and exit settings will necessarily yield different results.
The basic filter is stocks that close between 20 and 59 dollars and are +/-15% of their 90 day EMA where the most recent close finished greater than the previous days close.
Ok - in layman's terms I am trying to garner a list of stocks that are currently either 15% below their EMA 90 or 15% above their EMA 90. This was based on Dr. Brett Steenbarger's column today regarding the moving average and the fact that the SPX shows much better returns when it is below its 200 day moving average than when it is above. I just used an exponential moving average rather than a simple and individual stocks rather than an index.
I backtested the two filters against the same set of conditions most notably only one stock would be played a day (the highest 90 day average volume stock) and only 4 stocks would be held in the portfolio at a time. Using a 100K bankroll that meant that no more than 25K would be played on any given stock. I set my hold period to no more than 4 days or 10% loss or 15% gain or momentum greater than 2 whichever came first.
The envelope please - in both instances a 77 day period was used (ending on 11/22) which meant that 77 stocks were picked. Of the stocks that began greater than the EMA 90 the end result was a loss of 183 dollars. Of the stocks that began less than the EMA 90 the end result was a gain of 29831 dollars. Big difference.
Then, for fun, I switch the EMA to a simple moving average using 200 as the base. The end result this time for the less than 200 day moving average was 26484 dollars - a small difference. However, for the greater than 200 day moving average the result was 11632 dollars - which is a big difference.
But in both instances Dr. Brett's experiment is supported - you should have better returns with stocks starting from below a long term moving average than with those starting from above. That is a result of regression to the mean.
If I have the time over the weekend I'll try this with a couple of other moving averages - specifically the EMA 21 and the MA 20. Needless to say I could get really classy and start combining long and short term averages and if I don't get too confused I might try it.
I used Stockfetcher.com for my filtering and backtesting software. Different date ranges and exit settings will necessarily yield different results.
Saturday, November 11, 2006
Whenever I Fail
And yes, kiddies, I do fail – not often but 1 out of 5 trades will go sour on me. I have analyzed these failures and in almost every instance it was because of one of two reasons – either I placed my stop in the wrong place by pennies or I was not patient.
Nothing annoys me more than putting a stop in some 50 or 60 cents below the price – going away then coming back and finding that the stop was swept and the stock had gone up a buck in the interim. And this has happens too frequently to be an accident. The worst part is the price might not have been that low – maybe only the bid hit your stop and they took out my trade anyway off the bid being that low for a single instant in time.
Other times the specialist running the stock just dropped down for a minute to sweep all the stock up below a particularly large offer that he had just received and he made instant huge profits as a result. My solution, of course, is to only play well-regarded highly liquid stocks outside of earnings announcements. Although to be honest if an announcement comes that drops your stock - just because you have a stop doesn’t mean crap – you are going to lose anyway. This is something I wasn’t aware of until one day several years ago now I lost 25% of an investment in such a manner and even though I had a stop – tough. If there is no bid at your stop you don’t get to use it. But by playing highly liquid stocks that are generally well regarded you really don’t need a hard stop so most often I don’t use one.
But the biggest problem is patience – part a - I get impatient with trades that just sit so I close them out only to watch them go up immediately thereafter. Or, part b - I see a trade that drops down a little and I panic and close it out only to see it go back up.
The solution to part a - if a trade isn’t losing money then it shouldn’t be closed – Doh!
For part b - if the trade does drop if it was played properly it probably will bounce off the EMA right below it and shouldn’t be closed until it clearly passes through that EMA. In other words wait for the price to tell you to close and don’t just close arbitrarily. In almost every instance a stock’s price will bounce after it goes down which will permit you to get out nearly even if not a little bit in the black. You must keep this in mind as you trade and not adopt a doom and gloom scenario to everything.
Now I know that I said in almost every instance this is why I fail by which I mean that 2 out of 3 of my failures are due to the above. The third instance of failure is almost always - I jumped in too soon and didn't let the set-up develop. That is easily solved - follow the process!!!!
Nothing annoys me more than putting a stop in some 50 or 60 cents below the price – going away then coming back and finding that the stop was swept and the stock had gone up a buck in the interim. And this has happens too frequently to be an accident. The worst part is the price might not have been that low – maybe only the bid hit your stop and they took out my trade anyway off the bid being that low for a single instant in time.
Other times the specialist running the stock just dropped down for a minute to sweep all the stock up below a particularly large offer that he had just received and he made instant huge profits as a result. My solution, of course, is to only play well-regarded highly liquid stocks outside of earnings announcements. Although to be honest if an announcement comes that drops your stock - just because you have a stop doesn’t mean crap – you are going to lose anyway. This is something I wasn’t aware of until one day several years ago now I lost 25% of an investment in such a manner and even though I had a stop – tough. If there is no bid at your stop you don’t get to use it. But by playing highly liquid stocks that are generally well regarded you really don’t need a hard stop so most often I don’t use one.
But the biggest problem is patience – part a - I get impatient with trades that just sit so I close them out only to watch them go up immediately thereafter. Or, part b - I see a trade that drops down a little and I panic and close it out only to see it go back up.
The solution to part a - if a trade isn’t losing money then it shouldn’t be closed – Doh!
For part b - if the trade does drop if it was played properly it probably will bounce off the EMA right below it and shouldn’t be closed until it clearly passes through that EMA. In other words wait for the price to tell you to close and don’t just close arbitrarily. In almost every instance a stock’s price will bounce after it goes down which will permit you to get out nearly even if not a little bit in the black. You must keep this in mind as you trade and not adopt a doom and gloom scenario to everything.
Now I know that I said in almost every instance this is why I fail by which I mean that 2 out of 3 of my failures are due to the above. The third instance of failure is almost always - I jumped in too soon and didn't let the set-up develop. That is easily solved - follow the process!!!!
Wednesday, November 08, 2006
The Importance of the 90
The 90 period EMA that is - if you don't know what and exponential moving average is I suggest you look it up. On the following charts (2 year weekly) the blue line is the 90 period EMA and the red line is the 200 period simple moving average. If you can't tell just by looking how important the 90 EMA is to understanding what a stock is doing then you need more than your eyes examined.
So when people start talking about the 200 period this or the 200 period that tell them to take 90 and get real.
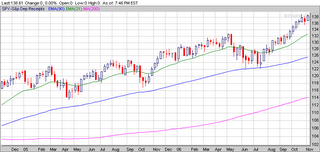
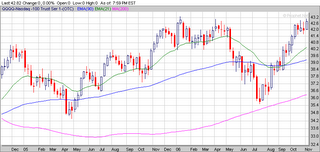
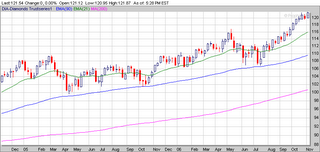
The other average shown (in green) is the 21 period EMA. I use that average as a gauge to determine whether the stock will be a candidate for reversion to the mean. Whenever it gets too far away from the 90 it seems to want to scurry back. Of course, "too far" is a nebulous term that can mean just about anything. If you watch the stocks for awhile you can pretty much judge what "too far" is just by eye.
So when people start talking about the 200 period this or the 200 period that tell them to take 90 and get real.
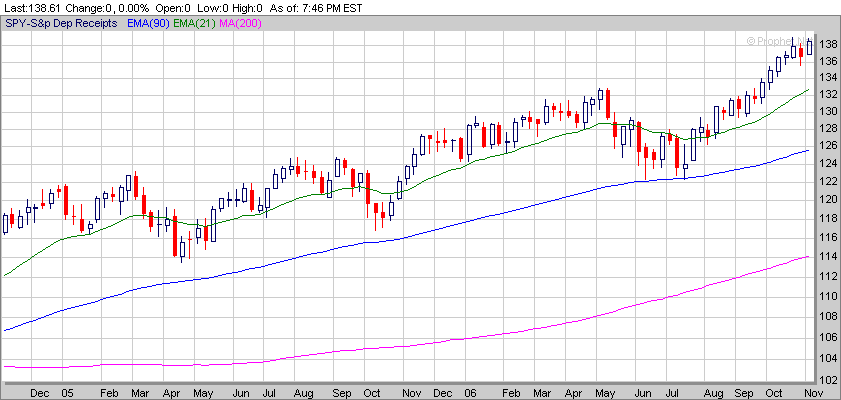
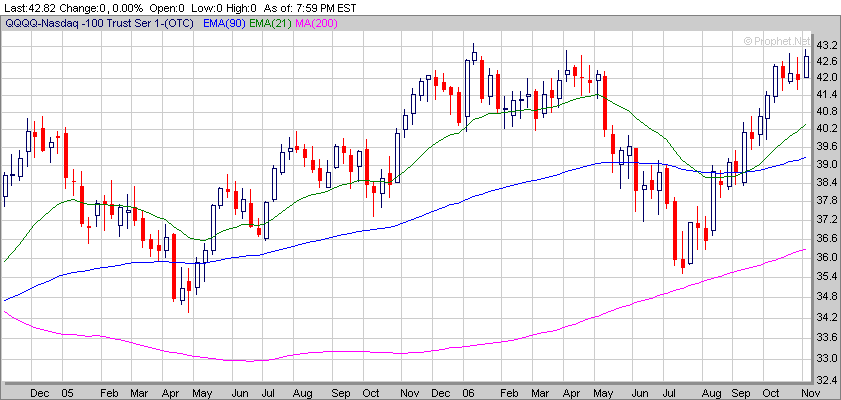
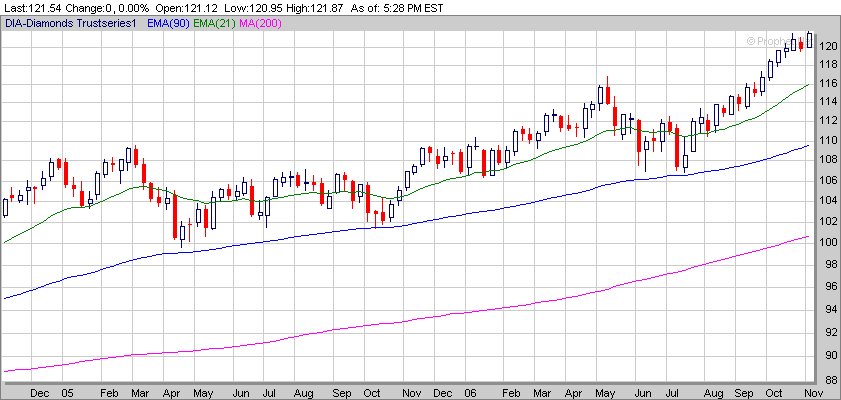
The other average shown (in green) is the 21 period EMA. I use that average as a gauge to determine whether the stock will be a candidate for reversion to the mean. Whenever it gets too far away from the 90 it seems to want to scurry back. Of course, "too far" is a nebulous term that can mean just about anything. If you watch the stocks for awhile you can pretty much judge what "too far" is just by eye.
Saturday, November 04, 2006
90% Of All Technical Analysis
Is unmitigated crap and the other 10% is just humbug. In other words it just isn't what it purports to be. The only thing you need is a stock with some momentum, a couple of exponential moving averages and candlestick representations of price. And it doesn't matter what time frame you trade in.
If you take the time to analyze the indicators that you use you will see that they are not telling you anything that you don't already know. The reason I use the exponential averages however is that I have found them to be wonderful predictors of what other traders will probably do. Only "probably" because we can't ever know for sure what the other several thousand people looking at this particular stock are going to do - or can we?
Friday 10 3 2006 - a particularly nasty day for longs and shorts believe it or not. Just because a market is going down doesn't mean that the stock you are in is. In fact it might have blown all of its downward momentum early and is now looking for a bid.
Anyway here is what you should be watching - the Q's - and if you happened to have had them up on a 4 minute chart with the 4, 8 and 21 EMA's here is what you would have seen...
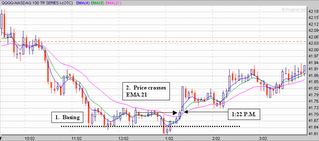
The Q's were basing begining about 11:20 or so. Now you wouldn't have known that until around 1 P.M. but seeing this pattern of prices with the 4 and the 8 EMA's intertwining tells you that traders are buying. Not just that selling has stopped but that buying is taking place with any selling that is going on. Just before 1 P.M. we had another attempt at a blow out bottom. I say another attempt because between 11:20 and then there were at least 3 others. Could be a false alarm - watch for awhile. At 1:22 or there abouts the price rises out of the consolidation basing area and crosses the 21 EMA. That is a clear cut signal that more buying is happening than selling. Quickly you switch to your watch lists and find --- NTRI --- and look what else you see...
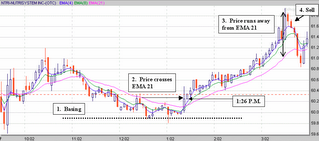
A couple of attempts to break out and then a tall white candle crossing the 21 EMA. See how the 4 and 8 EMA's had been intertwining - this suggests that someone was buying every offer and then some. The break out came 2 minutes after the Q's broke out - isn't that amazing. Now all we have to do is watch for a clear cut exit that came a little before COB. There was a blow out top - this is recognized by the fact that the price is running away from the 21 EMA. When that happens the 21 EMA acts as an attractor and pulls it back again. I would wait for two elements of confirmation which came quickly in the next 8 minutes and then sell - sell - sell.
And that is how you make a buck and change on a bad day without using technical analysis. Notice how I never mentioned ROC, MACD or Bollinger Bands - not once.
Oh one more thing - why do I use "4-minute charts"? Because most traders use 5- minute charts and I want to be one minute ahead of them. (That's a 20% advantage).
If you take the time to analyze the indicators that you use you will see that they are not telling you anything that you don't already know. The reason I use the exponential averages however is that I have found them to be wonderful predictors of what other traders will probably do. Only "probably" because we can't ever know for sure what the other several thousand people looking at this particular stock are going to do - or can we?
Friday 10 3 2006 - a particularly nasty day for longs and shorts believe it or not. Just because a market is going down doesn't mean that the stock you are in is. In fact it might have blown all of its downward momentum early and is now looking for a bid.
Anyway here is what you should be watching - the Q's - and if you happened to have had them up on a 4 minute chart with the 4, 8 and 21 EMA's here is what you would have seen...

The Q's were basing begining about 11:20 or so. Now you wouldn't have known that until around 1 P.M. but seeing this pattern of prices with the 4 and the 8 EMA's intertwining tells you that traders are buying. Not just that selling has stopped but that buying is taking place with any selling that is going on. Just before 1 P.M. we had another attempt at a blow out bottom. I say another attempt because between 11:20 and then there were at least 3 others. Could be a false alarm - watch for awhile. At 1:22 or there abouts the price rises out of the consolidation basing area and crosses the 21 EMA. That is a clear cut signal that more buying is happening than selling. Quickly you switch to your watch lists and find --- NTRI --- and look what else you see...

A couple of attempts to break out and then a tall white candle crossing the 21 EMA. See how the 4 and 8 EMA's had been intertwining - this suggests that someone was buying every offer and then some. The break out came 2 minutes after the Q's broke out - isn't that amazing. Now all we have to do is watch for a clear cut exit that came a little before COB. There was a blow out top - this is recognized by the fact that the price is running away from the 21 EMA. When that happens the 21 EMA acts as an attractor and pulls it back again. I would wait for two elements of confirmation which came quickly in the next 8 minutes and then sell - sell - sell.
And that is how you make a buck and change on a bad day without using technical analysis. Notice how I never mentioned ROC, MACD or Bollinger Bands - not once.
Oh one more thing - why do I use "4-minute charts"? Because most traders use 5- minute charts and I want to be one minute ahead of them. (That's a 20% advantage).
Subscribe to:
Posts (Atom)
