Showing posts with label dummy spot. Show all posts

Sunday, April 01, 2007

I Don't Rely on Technical Analysis

While it may appear that I do the fact is I rely on price analysis - I consider TA too slow for my objectives.

I discovered the rules for BOB by looking at charts that I generated using traditional TA such as Rate of Change, TRIX, RSI(14), MACD, Moving Average crossovers and the like and I was always wondering why I was missing half to two thirds of the move. In other words the move was happening without my noticing it until the traditional TA methods caught up. It was then that I had the most amazing thought of my entire life - traditional TA signaled the end of the move rather than the beginning.

In other words there was a class of buyer out there who were picking stocks based not on fundamentals and not on TA but on price/volume action. They were loading up and as soon as the retail trade, using traditional methods noticed the move, the original buyers were selling off to the retail trade and the move was on its way to being finished.

Using my analytical abilities coupled with a good memory I began to see certain patterns at the origin of the move - one of these was BOB and another was the dummy spot which is also termed Narrow Range 7 (NR7) or Narrow Range 3 (NR3) and in traditional Japanese candlestick parlance is called the morning star. NR7 and NR3 can be found anywhere and a lot of traders like to use them in the context of what I call the return to 4 trade. They like finding an NR7 or NR3 at the end of the return - it gives them a high confidence in the pattern. But the morning star is only found at the bottom of a decline.

Here is an example of a move that could have been caught off the morning star formation - this one had two in case you didn't notice the first one.


The traditional trader waits for the MA crossover and depending on the MA being used such as an EMA over the 200 or the far more traditional MA50 over the 200 - the move is already well underway by the time the retail trade catches up with it.

When I do use TA I try to use it in an non-traditional manner - for example an RSI(2) below 2 is as non-traditional as you can get. And the probability is that it won't stay there for long.

Here's another example of a trade that can be taken relying only on price action-


If you look at the third week in July you will see the third candle of the all powerful BOB - see - you don't need TA to get into great trades over a long term.

Saturday, March 24, 2007

Using BOB as a Day Trade Starter

When I began day trading one of the more difficult problems to solve was finding stocks to trade. I used gap-up and gap-down screens right after market open and these work well but sometimes some of the best trades are neither gap up or gap down.

So I think that that I have solved that problem for good by using the BOB set-up filter to find potential day trades. And had I been at my station Friday instead of beating a white ball around I would have had a beauty – IN.

The BOB set-up filter finds the first two candles of the set-up and then relies on you to find the third candle.

Here is how IN looked on Thursday with the BOB set-up – you can see how the set-up converted to a full BOB on Friday – it opened and went up – i.e. the low of the day Friday was above the low of Thursday. And that is key and critical to a BOB set-up.


The 15-minute chart looked like this so if you didn’t want to take the crossover entry off the BOB set-up you could have taken one of the returns to 4.


Here is how those looked with the pivot points in place. I used the extended pivot points to illustrate this trade.


This chart also has a couple of other interesting features – one is the dummy spot on Thursday coupled with the RSI(2) < 2 and the other, not annotated, is the last three 15-minute candles on Thursday have a BOB, an RSI(2) < 2 and a tweezer bottom all in the same three candle set-up. I never recommend starting a day trade overnight on something like that but it would have lent credence to the next day’s action. And as soon as you saw the crossover you could have taken the trade with confidence.

Saturday, November 11, 2006

Two Hours to Tombstone

Ok – it wasn’t a movie – but it is an apt title for a process that looks at 2-hour charts to find bottoms. I’m going to show you three examples starting with one that contains a little dummy spot. After a period of relentless selling as shown on the 2-hour charts it is always a good idea to watch the opening hour or so the next day. If you see some movement in the opposite direction you probably have a winning trade developing even in the absence of any traditional set-ups. I call this selling exhaustion. Now some people would say well I could look at the RSI or other momentum indicator and see that to which I respond – maybe, maybe not. In fact of the three examples I will show here not a one of them printed an RSI below 25, at least not on the 2-hour charts.

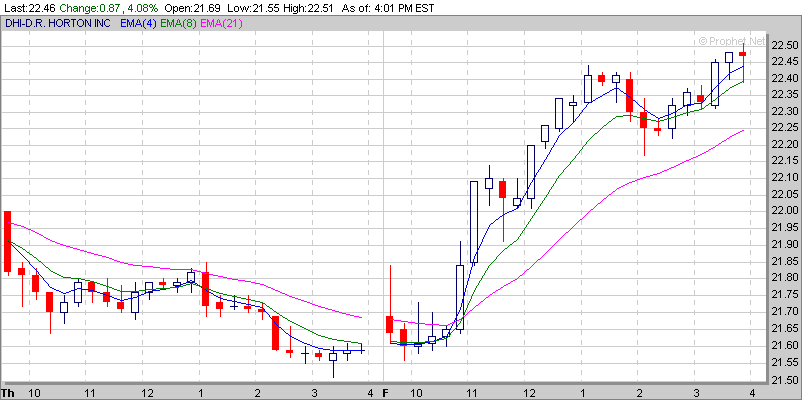
First up – DHI. This is a homebuilder, and builders as you know have been beat up mercilessly over the past several months. However, every once in awhile a buyer or two steps in and starts to grab up shares. This usually happens right after some heavy selling. Here is what that looks like –


That little candlestick in the final position on Thursday is an actual “dummy spot”. When you see that the next move is generally up.

The next day on the 15-minute charts you can see that DHI gaps up a bit then loops down then takes off for the sky. Because of the gap up and the dummy spot on Thursday this would have been a good stock to watch for just this type of move on Friday.


I know Sally, I wish I'd had it too.

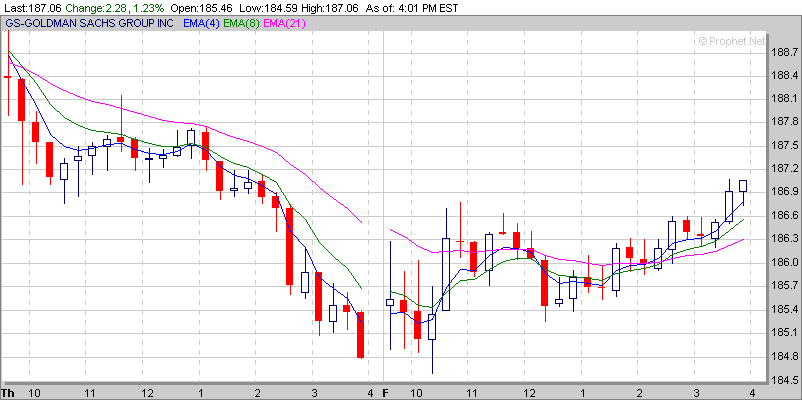
The next example is just relentless selling. No dummy spot, NR7 or any other indicator – GS was just being hammered down on Thursday. So on Friday what happens but a gap up and the rest is history. Again – in the face of relentless selling as seen on Thursday for this, a generally well-regarded stock, it pays to keep it on the watch list and if you see a change in direction, scoop some up.


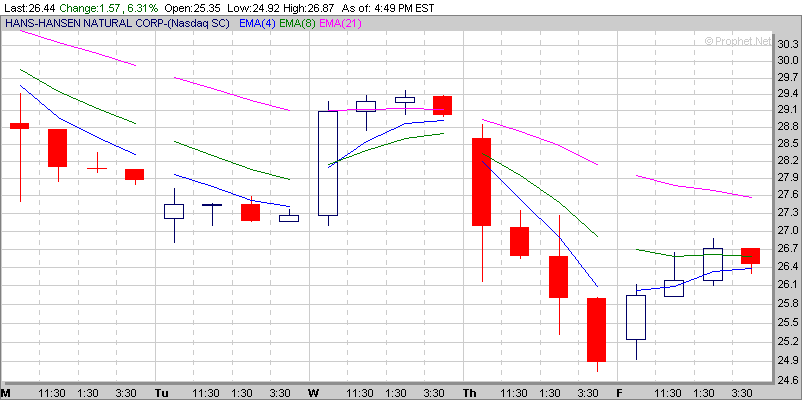
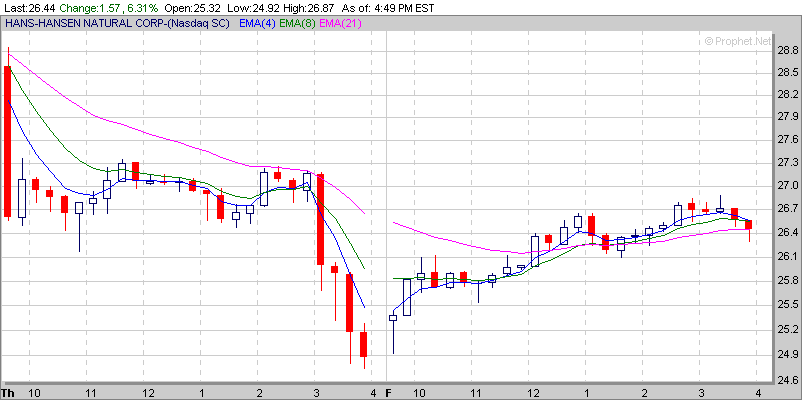
The final example is one of my favorites, HANS. And this one is exactly the same as GS – relentless selling all the way into the close. The next day however there is a gap up and a very clear indicator (hammer) that the direction for the day is going to be up – up - up. I took a position off the confirmation second bar and held nearly to the top. Lucky me.


One way to make this work is to do some after hours or pre-market work and find a list of stocks that have gone down that day or preferably over several days. Then view them on two hour charts and see how they did it. If they were stone cold drops they might be plays but are risky. But if they show relentless selling over the course of the day you might want to watch them the next day.

Once more props to prophet.net - the excellent charting service that I use. I don't get anything from them so go on over there and take a look. You might like their site.

Tuesday, October 17, 2006

Rainy Days and Tuesdays Always Get Me Down

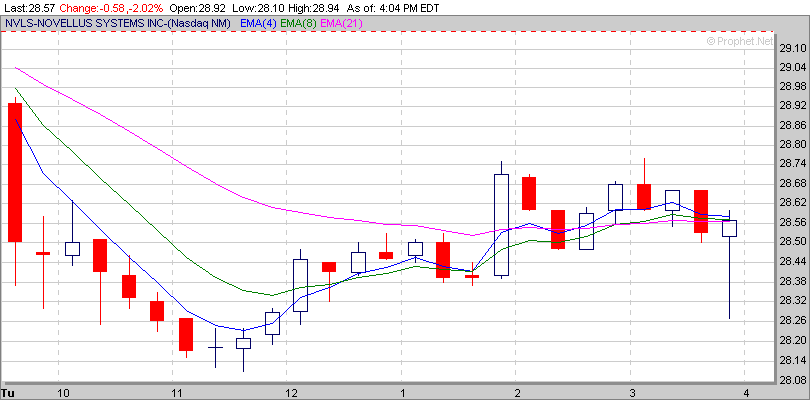
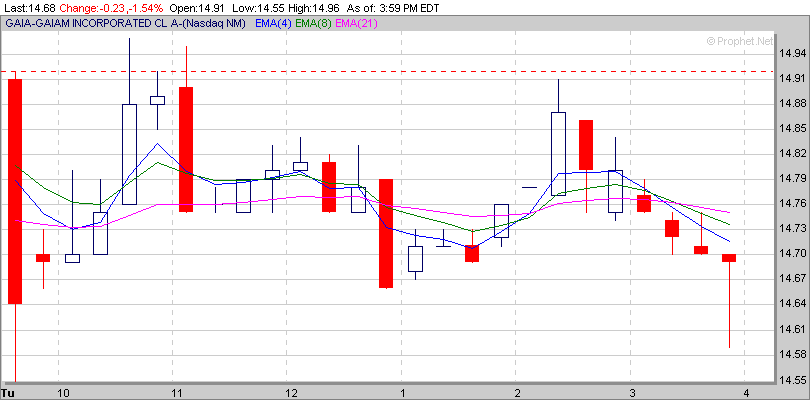
Rained today and not only outside but also in my account. I said this morning how I should trade, I described it clearly and then proceeded to not trade that way. This is a dummy spot -


Does anyone see anything that even partially looks like that in this???


No? Are you sure? Ferris? Ferris? No? Me neither - so guess which one I bought and if you guess NVLS you are just being a smartass. I did the bad thing three times - not being satisfied with just one - fortunately I managed to escape with only minimal damage but damage all the same.

I guessed right today as far as market direction - down - but that was easy. Tomorrow is shaping up as a buy the dip day - the up/down ratio is 32% and the new highs pulled way back to 665 and the new lows increased to 140. The VIX is back in the neutral zone and the only fly in the ointment is that the three sisters all finished the last hour in the red.

I still think it is buy the dip and up up and away.

The magic coin is 19 and 9 having called today correctly and for tomorrow --- tails - bear market again.