Showing posts with label DHI. Show all posts

Saturday, May 19, 2007

Here Come The Homies

The other day we had the economic report regarding the lowest number of building permits being issued in 17 years. I said - that's the bottom - apparently a lot of hedge funds read me because -

XHB

That's the homie sector ETF and, yes that's a cross over. What I like about this cross over and I don't like about the one several days ago on 05/09 is that this one was preceded by a BOB formation too. And that is an excellent entry into the cross over.

Here's a couple of builders and guess what


And my favorite - DHI


I'm not suggesting that you run out and get some - but I'd certainly keep an eye on XHB for awhile and if you get a weekly cross you might want to get real re: real estate.

Monday, April 23, 2007

It Might Be A Good Week

The Weekly BOB filter has a whole bunch of good candidates for this week and I'll just give you the top 5 of 26 (by volume)

SBUX
DHI
PALM
NDE
BPOP

Two of these BPOP and DHI already announced earnings on the 19th. SBUX is coming up on the 3rd of May, PALM isn't until June, and NDE is announcing on the 26th.

None of these appear to be bad on the daily charts but do your own due diligence.

This is not an invitation to speculate in the biggest casino on earth - the U.S. stock exchange where fortunes are lost, hearts are broken and total ruin is the only possible outcome. There is a good reason why the sign - Abandon Hope All Ye Who Enter Here - is posted above the portals of the NYSE. You've been warned.

Tuesday, February 06, 2007

Wrapping Tuesday

Bernake speaks - he says - don't worry - education and training will help narrow income inequality. That is - education for those who can afford it - which means parents who can afford it because you don't get through school jerking sodas anymore - not at 5.25 an hour or even 7.25 an hour. Which means - we're screwed. But you all knew that already.

But that's not what I'm here to talk about today - I'm here to talk about this amazing new stock market of the new intertube century - it slices - it dices - it cures every ailment known to man and a couple not even discovered yet - it goes up and down like a psychotic yo-yo - watch the shells boy and try to pick the walnut with pea under it - I'll give you two chances for one money ... would you like to try again?

Wow! Will this ever end? There were so many set-ups coming about mid-day I didn't know what to do. Here's several that you can look up for yourselves (all 15-minute charts) - at 11:45 JNPR printed a dummy spot followed by clear confirmation that also formed a tweezer bottom at 12:00. It took off from there. At 12:45 to 1:15 MSFT formed a classic blow-off bottom (sorry Jim) and took off from there. At 11:30 SYX formed a classic blow-off bottom with a confirmation 15 minutes later. It took off from there. SPY printed a tweezer bottom at the 11:45 - 12:15 on the 15-minute bars. In the 11:45 to 12 time period on the 1-minute bars you can see a huge 2.5-3 million share sell in SPY that was probably one transaction. After that the market reversed.

I took a bit on SYX - a stock I'd never played before. And got out at the dummy spot at 1:30.

Still holding CRVL even though it gave up a buck and a half today - probably get it back and then some tomorrow. Also holding DHI and it is only 20 cents away from where I bought it despite the best efforts of thestreet.com's loyal 10 subscribers. Still holding JNPR - it is in a nice chart formation and I think it is going to continue to go up - I'm looking at 18.90 as a target. I did sell the Q's this morning just as they jumped up at the open because I thought that they were going to go down from there hard. They did, then recovered most of it. Holding KKD too - although the next time it goes profitable I'm out because I think it is done for now. I'll wait for another set-up in the future.

I knew ahead of time that this was going to be a strange day because around noon I took a look at the up/down ratio and there were more stocks up than yesterday and the market was crashing all morning. How can stocks go up with the indices down - damifino but they do and they did.

CSCO beat - that probably means a 20 point day on the NAS tomorrow. GOOG went up today - it too had a classical blow-off bottom 11:30-12:15. Remember the BOB is characterized by a minimum of two down bars (Red) with elevated volume on the second down bar. This is followed by a Green/White bar with a higher low than the last Red bar or an absolutely equal low (tweezer bottom) with the last red bar. That is all it takes and if you see this formation you buy it and put your stop someplace below the low of the Green/White bar. You choose the spot but some multiple of the 15-minute ATR would probably be appropriate. For GOOG at that moment it was about 2 bucks which seems about right. Who in their right mind is going to day trade GOOG? Here is an example of BOB on the hour charts (yes you see it on all time scales). Of course the longer the time scale the longer the run (generally) so if MSFT goes up tomorrow too - don't say I didn't try to warn you.


Nuff of that. The up/down ratio went up today to 43% which is neutral. The new 20-day high/low ratio is 77% which still means an overbought market ahead of us. Four of the five majors finished with white candles in the final hour, only the Q's were down and the VIX remains neutral - if I were the VIX I'd probably want to stay out of it too.

I'm forecasting tomorrow as an up day. I want a downer so bad that I'm calling for an up day (although I'd take one like today but that just doesn't happen that often). It probably will be mixed again, but we'll see.

Meanwhile old magic coin says --- tails - bear market again. The coin just never learns.

Having missed today by the barest of margins, the score is now Marlyn 8 - 6 and 4 and the coin is 6 - 8 and 4. Marlyn is just barely better than lucky (which puts him head and shoulders ahead of Jimmy Crack You Know Who).

Forgot to mention - I absolutely love this stuff - every boring minute of every boring day and I hope that my absolute passion for it plays through in my writing. Have a good evening.

Monday, February 05, 2007

Wrapping Monday

I'm not feeling too well - I guess I picked up a bug last week when I was on the road. Probably not too difficult when you observe how many people cough without covering their mouths with their hands at least. Anyway I have a miserable head cold so I'm mostly watching today and thinking.

I saw an opportunity to grab some DHI on a minor pullback so I took it. I bought it on a blow-off bottom around the noon hour that was also a tweezer bottom on the 15-minute charts. Then at 4 minutes to the close I bought a load of JNPR based on a report I read in Notable Calls and the fact that it too was forming a bottom in the final hour of trading. I will probably sell this one tomorrow.

That makes the load CRVL, KKD, still holding the Q's even though they are profitable and I swore I'd sell them, and now DHI and JNPR.

I was going to buy FNF but it just didn't look good to me. It will probably report good earnings and go to the moon tomorrow morning. But maybe not. I don't have a feel for it and I still don't like holding stocks through earnings unless I do have a feel for them. Of course at about 2:30 it started catching a bid and it went up 60 cents in the last hour and a half. I don't trust after hours so we'll see tomorrow but the earnings were down.

I did notice that GOOG had another "long squeeze" today. A "long squeeze" is when the retail traders sell all their many millions of ... wait, retail traders don't sell millions of shares ... well who's selling then? I don't know but there are a lot of 200 - 1000 lots coming across plus quite a few larger than that. I can guess that most of these are not retail traders because the time and sales window is color coded and most of the trades are in cyan - that means the trade is not at either the bid or the ask. Contrast that to a GM for instance where most of the trades are in red or green (for bid or ask). I don't know why GOOG is losing ground - I think it is possible that people are taking profits to pay for Christmas now that the bills are coming in. Yeah - sure.

Speaking of GM - back in early December Carl Icahn sold off his holdings because as he said, and I'll paraphrase - dumbass company won't listen to me so its stock is going to go down. He managed to beat it down to 28 and change in a couple of days and since then it has gained back about 5 bucks - 3 higher than where Carl sold. So much for Carl as stock picker - see just because you have barrels of money doesn't mean you're smart.

But I'd like to do another object lesson on this same theme. Let's say that on Jan 14th or so Jimmy Crack Corn Pone said that GOOG was going to 513 and from there a short squeeze would take it to 520. Let's say that you believed him and with 10K of your hard earned money you bought GOOG on 1/16 at 507 (approx the open) and you got 19 shares. Today your 19 shares are worth 8971. If you had gotten the 19 shares to 520 you would have a 247 dollar gain. If on the same day you had used the same 10K to buy 324 shares of GM it would be worth 10692 today or 692 dollars in profit or nearly 3 times the profit you might have gained with GOOG but didn't.

The point of this exercise is not to ridicule Jimmy Crack Corn Pone (although I can't help myself I really can't) but to show you that you have choices where to put your money - or as your mother used to say - if everyone was jumping off the bridge would you jump too? Sometimes it just makes good sense to buy an old sticks and bricks company like GM. From a traders perspective GM is a great day trade up or down - just watch the Dow and go with the flow.

Broker A over at Fly on Wall Street has a rant up regarding the fact that GOOG should split - and it probably should about 5 to 1 if not more. If it were anywhere near BIDU you'd be able to make direct and realistic comparisons.

Unless you have Marlyn's Curve. I'll do a post later today or tomorrow showing GOOG, BIDU, and YHOO as you've never seen them before - it's pretty neat.

MSFT and AAPL were both down today but MSFT looked to me like it might go back up again tomorrow. AAPL just looks tired and I have a feeling it will be taking a long rest. SMH looked like it put in a maximum top today - three gaps up and a DOJI star. I wouldn't be surprised to see it drop a bit tomorrow. Of course volume is drying up in just about everything. I'm not sure what everyone is waiting for but I don't like this quiet - it's too quiet.

The up/down ratio has pulled way back to 38% and the new 20-day high/low ratio also pulled back to 74% which isn't great and still reflects an overbought market but some relief is in sight. The last hour was mixed with a couple up and a couple down. And that story is getting to be real old too. The VIX has pulled back into neutral territory which is OK but I'm calling tomorrow a down day. And that is based on the tweezer top that formed on the SPY and IWM today and Friday. They weren't perfect but they were within 2 cents of one another and that's close enough for me. Between that and the absolute minimal volume across the board and I think we need a few days of downward movement just to get the pressure off.

Meanwhile in magic land the coin calls tomorrow --- tails - also down.

Let's call today what it deserves to be called and that is another mixed day or what I'm calling a tie. I lost money on my several investments today but they are all green from where I bought them.

The score is now Marlyn 8 - 5 and 4 and the coin is 6 - 7 and 4.

Friday, January 12, 2007

Friday's Wrap

As noted earlier - after a month of holding for a better day I sold SYMC for an 18 cent loss - could have sold it yesterday for a half buck profit but nooooo had to hold it. Who would have suspected that good news such as an open portal to sell your goods to a couple of billion Chinese would be seen as such a bad thing on Wall Street. There is absolutely no rationality in this market.

I completed the first round buy on Glass (GLW) and also added to my DHI holdings. Not quite back to where I was but I will probably get there next week if they keep edging up.

Going to keep this simple today - the up/down ratio dropped back a bit to 56% but the new 20 day high/low ratio went ahead to 79%. That plus the fact that the VIX is 12% less than its 10 day moving average suggests a down day coming on Tuesday. Add to all of that the fact that the Q's, DIA, SPY, IWM and GS all put in strong white candles in the final hour and we have to say Tuesday is definitely a down day.

The magic coin says tails - also a down day.

Today makes Marlyn 3 and 2 and coin 2 and 3. We are not doing very well this year so far.

Later this weekend I'll show you the difference between a scalper special and solid investment and how to tell when to hold 'em and when to fold 'em. That's if Blogger ever allows charts to be uploaded.

Thursday, January 11, 2007

Wrapping Thursday

Fortunately I wasn't around much of today having had a little personal business to get out of the way. It seemed that for all the action in the indices the only thing that moved was - I really don't have to tell you this do I? - Homebuilders! DHI made back 54 cents and I made back most of my losses. Meanwhile SYMC managed to round trip a 40 cent profit and turned in a 13 cent loss - on a day when the COMPQ was up 25 points. One more day and I'll be done with that piece of crap. Not that I don't have a profit - I do - but I think the money will be better used somewhere else.

For example - I bought some Glass (GLW) on the open based on the dummy spot on the weekly charts from two weeks ago followed by a doji last week. All of that looks like a bottom. It went up today and given its recent past this generally this means a smack down tomorrow but GLW will be my new swing trade. Today it is printing a crossing formation on the daily charts. If GLW confirms tomorrow I'll finish the buy for this round. I never got past round one on SYMC because it never went anywhere. Should rename that stock the old yo-yo. To put things in perspective I made more today in a half position of Glass than I've made in a month in SYMC.

Since I was out I didn't do any mo-mo day trading today. Just as well none of the usual suspects did much of anything. CRVL limped around for a bit and round tripped 60 cents which is nothing for that stock - it usually round trips a a buck and a half every hour or so.

GS looks like it was shot out of a cannon and then just sat in space all day. Most of the activity in the market seemed to be over by 11 A.M. My darling from yesterday CTXS gained a half a rock today. Had I been around I probably would have played it again off a "gap up - pull back" play.

Going to be out early tomorrow so I don't think I'll make any plays at all unless I fill GLW.

Which is all well and good because I think the market will take a rest tomorrow - the up/down ratio is 60% which is not too terribly bad but the new 20 day high/low ratio is 70%. That, coupled with the VIX being more than 5% below its 10 day moving average, suggests a down day coming. We have a split ending in our four majors with two red candles and two white candles in the final hour and GS, that old tie-breaker, landed on its edge - a doji (still tired).

My prediction - down tomorrow and the magic coin says ... tails - it agrees. So once again we will both be right or both be wrong.

So far - Marlyn 3 and 1 and the coin is 2 and 2.

Monday, January 08, 2007

Wrapping Monday

I wanted to do some of this as a midday report but Blogger wouldn't allow me to upload a figure that I am using later and so I'll do it as the normal wrap.

Maybe tomorrow we'll be able to do a "midday report". Maybe tomorrow Blogger will sprout wings and fly. Shouldn't complain - you gets what you pays for.

Picked up RAD as a day-trade - gapped up and came back to the EMA 4 and that's when I grabbed it up. Same with BSX. Sold off RAD mid-afternoon as it seemed to be done. Decided to hold BSX (convert to a swing) as it looks pretty strong. There were a number of these types of set-ups today - these were just the two I took.

Speaking of the "gap up fall back" set-up, one of Broker-A's favorites, MVIS, did that this morning. MVIS looks like it is finally catching on. They are developing a heads-up display for automobiles - just what we need - another driver distraction. Actually the tech market is so barren of new ideas that any idea sounds great. I mean let's face it how many different ways can you say "telephone and takes pictures" and make it sound new and exciting - twice? So MVIS is being rewarded for innovation if nothing else.

SYMC is up a bit. This one is driving me nuts. I'd be better off day-trading it than holding it as a swing. I'll hang in there one more cycle (4 days) and if it doesn't break out of this range (> 21.80) then I'm out of it. We'll see on Friday. If I do sell it will be your signal to load up. I dumped nearly all of my DHI this morning - maybe housing isn't ready to go up. I'll keep an eye on it and if it turns I'll get my losses back - they weren't too severe but I hate losses.

Picked up some CRVL on a reversal day-trade this afternoon. I sold at COB for a buck and change. I keep this one on my screens all the time - it is a thinly traded stock with a massive spread but I usually buy it as a limit trade by putting my bid square in the center of the bid-ask. Somebody hits it almost immediately. There are a lot of scalpers in this stock. Selling is the same process - put it out between the bid and the ask and some fish will rise to the bait. Trading is like fishing - a lot of patience and knowing where to drop your line goes a long way.

One of my fellow Bloggers - Bullish Jim - bailed on CTXS last week and look at it today - up a buck and change and look out above. Only wish I had jumped on it at open this morning (just kidding Jim). Actually I'm not, Jim. CTXS put out a "buy me" crossing signal this morning and I saw it but got distracted and by the time I got back half the move was made. That "buy me" crossing signal looks like this.


You will see this on just about every time period including daily, weekly and monthly. I use three EMA - 4, 8 and 21 and a "crossing" signal is when the open of the first 15-minute candle is below the EMA 21 and the close is above the EMA 4. When you get a confirmation (as shown in the figure) the next move is up - usually. Sometimes they fool us and go down but that is what risk management is all about. I normally set a stop just below the EMA 21 and that is generally sufficient. Readers of this Blog know that I also normally use "mental" stops. (Charts courtesy of Prophet.net - a good company).

This signal, by the way, works for shorts too (red candle crossing down) and works in many different markets. I have seen it work after the open (today NVEC for example) but keep in mind the rules are fairly strict - you must have the crossing and the confirmation before taking the trade.

I keep an eye out for this signal on my various watch lists that I have set up 24 to a page and start going through 15 minutes after the open. If I see the indicator I copy the stock to another watch list for the next 15 minute scan.

As for tomorrow - the up/down ratio is back to 52% (erroneously reported earlier as 60%) and the new 20 day high/low ratio is at 35% which is mixed. The VIX is still more than 5% greater than its 10 day moving average which, while not a hard and fast indicator, does suggest a certain amount of oversoldishness. The four indices that we track (via their ETFs) all finished the last hour in the red and GS finished with a doji. That last is understandable given the 4+ point gain it had today - poor guy had to be plumb tuckered out. Or as we New Yorkers say - "Dat guy is f'in tired." Put all of this together and it spells - another up day tomorrow. And that's my prediction.

The magic coin says - tails - bear again.

OK the score so far is Marlyn - 1 and 0 --- Coin 0 and 1 - the race has begun.

Friday, December 29, 2006

Wrapping Friday

As expected a down day - the problem being there isn't anybody around who really cares enough to buy anything. Given the extra day off next week (Tuesday) nearly everyone who is anyone took off at noon today to prepare for the 4-day mourning session honoring our only unelected President. I know I'm going to pull out my old WIN button and wear it proudly for the next 4 days. (WIN = Whip Inflation Now - Gerald Ford's answer to some of the most miserable run-away stagflation ever to hit the country).

I end the year holding SYMC even though it backed up today, DHI, and I added a very small position in GM this morning. I will be holding them through next week in anticipation of the coming boom in the stock market. Actually I'm taking all of next week off. Nothing special just a short trip I've had planned for awhile.

For a recap - the up/down ratio is now at 38% and the new 20 day high/low ratio is 42% and the VIX is 7% over its 10 day moving average. These things mean that next week will be a good one - at least on Wednesday. I'd really like for the market to fall back for the next two weeks and then, when there is lots and lots of things to buy, take off from there.

With the exception of the SPY everybody else (DIA, QQQQ, IWM, GS) finished with a red candle in the last hour - which is good. That means that there was even more capitulation following through from yesterday.

I'll be back later this weekend with a fearless prediction for the next year - it doesn't matter whether I'm right or wrong - it's just something you can look at and compare with all the other fearless no nothings out there.

The magic coin having nailed today finishes the year 42 - 31 and if you don't know how much better the coin is than Cramer you just aren't paying attention. For the First Trading Day of the New Year the coin says --- Heads - bull market -

And that's a wrap.

Friday, December 22, 2006

Wrapping Friday

OK - I got my wish - a pretty good draw down for the week - that will set-up next week just fine and we can continue with the bull run. I'm still holding SYMC and DHI with no changes.

The up/down ratio is at 36%, the new 20 day lows are outpacing the new 20 day highs almost 2 to 1 and the VIX is actually 6% over its 10 day moving average and moving into oversold territory. All four majors and GS finished with strong red candles in the last hour and as you know - that is a good sign because it calls for a contrarian position. All in all Tuesday may pay for Christmas for those of us who are positioned to take advantage of it.

Magic coin missed today so he's 39 - 30. For Tuesday he says --- heads - bull market - I'm going along with this one.

Thursday, December 21, 2006

Wrapping Wednesday

Great day! I didn't do much trading - just watched a bit, wrote some new posts and, what else, went shopping. I think we are almost done but I never factor "done" into this calculous because "done" implies "finished" and my bride never really is. I'll be scurrying around on Christmas eve trying to find one more wingbootentooter for Aunt Millie or some such play pretty as that. No I don't know what any of that means I'm just tired. But the stores were a whole lot more crowded today than they've been in awhile so maybe everyone final got the memo - 3 days left.

Still holding SYMC and doubled up on DHI. I do that on the second day of a trade sometimes if I expect the trade to go up - which I do.

The up/down ratio sits at .36 which is in oversold territory, the new 20 day highs peeled off 100 to 381 and new 20 day lows went up to 604. Another great sign because that means that there is actually something out there to buy. The final hour saw a mixed batch with DIA, SPY and IWM finishing with white candles while the Q's and GS finished red. Doesn't matter - volume tomorrow should be in the single digits. The VIX has withdrawn to the neutral zone and that means no volatility for the options guys or the day traders either.

I'm looking forward to a quiet day tomorrow regardless of any news. I just saw that RIMM is up 6 bucks and change after hours on its great profits last quarter so that might serve as a bit of a catalyst for the tech area tomorrow - we'll see.

Magic coin is now 39-29 having called today correctly so we'll give him another chance to make a fool of himself and calls for tomorrow ... heads - bull market. I suppose it's possible - two down days in a row...

Wednesday, December 20, 2006

Homies

The homebuilder sector has been on the down and out for awhile. I just finished reading in Seeking Alpha about Hovnanian’s “gruesome quarter” and indeed it was gruesome. The best part however was the way the CFO lowered expectations for the coming year. Now if they post any profit at all it will be a prelude to the second housing boom. That was the good news – they are at rock bottom, they can only go up, and they are positioned for some bad quarters ahead.

Then I looked at the chart – and you can see for yourself that we all should have been in housing for at least a month already if not more.


You see in November where on the weekly chart the candle bisected all three averages? That followed an obvious blow-off bottom the week before. Then the only thing that happened on the “gruesome quarter report” was that the stock “kissed the EMA 8” (as I call it) and rebounded smartly. All of this together suggests to me that these stocks (TOL, DHI, KBH, CTX and HOV) might actually develop some legs in the New Year. And if you don’t know which one to buy there is always XHB. The fact that its chart looks exactly like HOV’s is not a coincidence just a fact. The best part of this chart is the increasing volume since July. Brave souls would have bought on that indicator alone. Notice also the bisecting candle in mid-November.


Now I don’t particularly like “idea” stocks as in “my neighbor’s sister in law’s kid's best friend forever said that she doesn’t like this, that, or the other.” Those kinds of stocks always cost me money way back when. But I do like distressed stocks and the Homies have been distressed for a year. It might just be time to get some.

Now, of course, the last several weeks could be read as a rounding top and those steeples might mean a little more downside so if you do get involved stay awake, stay aware and be ready to get out if you can't take the pain.

As always this is not advice – just a guess – just like that bald guy on TV who is always foaming at the mouth and spitting at the camera – good ol’ what’s his name.

Saturday, November 11, 2006

Two Hours to Tombstone

Ok – it wasn’t a movie – but it is an apt title for a process that looks at 2-hour charts to find bottoms. I’m going to show you three examples starting with one that contains a little dummy spot. After a period of relentless selling as shown on the 2-hour charts it is always a good idea to watch the opening hour or so the next day. If you see some movement in the opposite direction you probably have a winning trade developing even in the absence of any traditional set-ups. I call this selling exhaustion. Now some people would say well I could look at the RSI or other momentum indicator and see that to which I respond – maybe, maybe not. In fact of the three examples I will show here not a one of them printed an RSI below 25, at least not on the 2-hour charts.

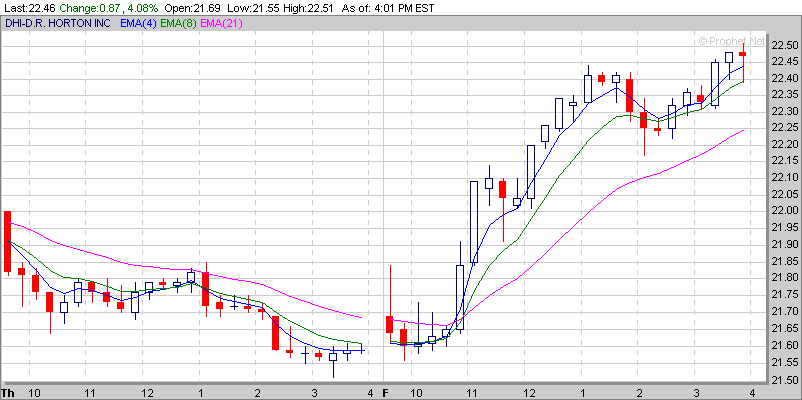
First up – DHI. This is a homebuilder, and builders as you know have been beat up mercilessly over the past several months. However, every once in awhile a buyer or two steps in and starts to grab up shares. This usually happens right after some heavy selling. Here is what that looks like –


That little candlestick in the final position on Thursday is an actual “dummy spot”. When you see that the next move is generally up.

The next day on the 15-minute charts you can see that DHI gaps up a bit then loops down then takes off for the sky. Because of the gap up and the dummy spot on Thursday this would have been a good stock to watch for just this type of move on Friday.


I know Sally, I wish I'd had it too.

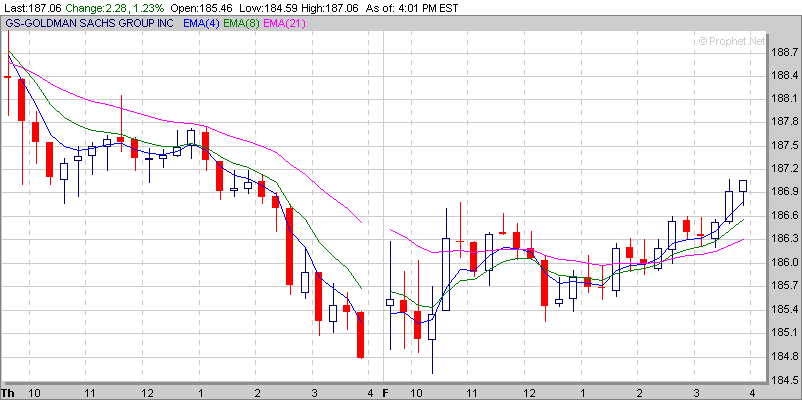
The next example is just relentless selling. No dummy spot, NR7 or any other indicator – GS was just being hammered down on Thursday. So on Friday what happens but a gap up and the rest is history. Again – in the face of relentless selling as seen on Thursday for this, a generally well-regarded stock, it pays to keep it on the watch list and if you see a change in direction, scoop some up.


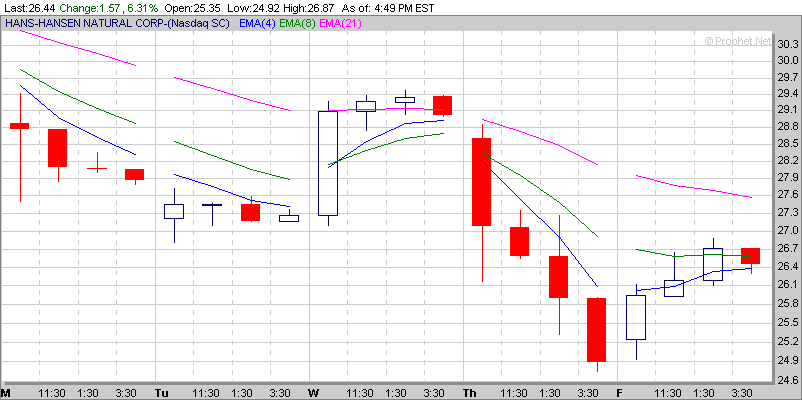
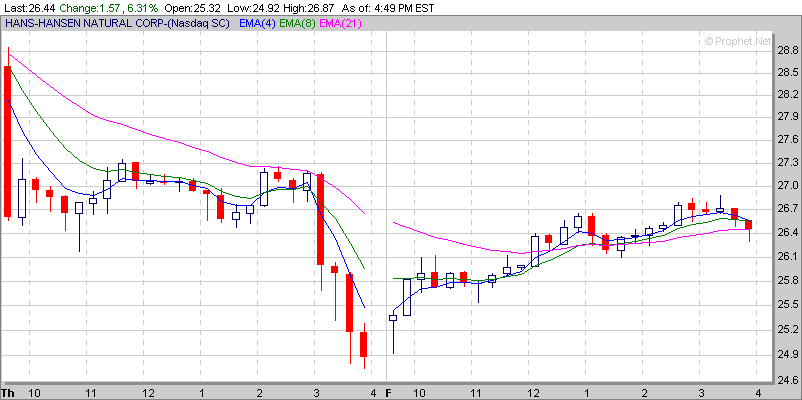
The final example is one of my favorites, HANS. And this one is exactly the same as GS – relentless selling all the way into the close. The next day however there is a gap up and a very clear indicator (hammer) that the direction for the day is going to be up – up - up. I took a position off the confirmation second bar and held nearly to the top. Lucky me.


One way to make this work is to do some after hours or pre-market work and find a list of stocks that have gone down that day or preferably over several days. Then view them on two hour charts and see how they did it. If they were stone cold drops they might be plays but are risky. But if they show relentless selling over the course of the day you might want to watch them the next day.

Once more props to prophet.net - the excellent charting service that I use. I don't get anything from them so go on over there and take a look. You might like their site.