True to the name of the site we have come up with a couple of new filters - this time for picking trades for swing trading. Simplicity is the key to the very best filters and these two are so simple even a caveman ... never mind that's been used already ---
The basic filter is stocks that close between 20 and 59 dollars and are +/-15% of their 90 day EMA where the most recent close finished greater than the previous days close.
Ok - in layman's terms I am trying to garner a list of stocks that are currently either 15% below their EMA 90 or 15% above their EMA 90. This was based on Dr. Brett Steenbarger's column today regarding the moving average and the fact that the SPX shows much better returns when it is below its 200 day moving average than when it is above. I just used an exponential moving average rather than a simple and individual stocks rather than an index.
I backtested the two filters against the same set of conditions most notably only one stock would be played a day (the highest 90 day average volume stock) and only 4 stocks would be held in the portfolio at a time. Using a 100K bankroll that meant that no more than 25K would be played on any given stock. I set my hold period to no more than 4 days or 10% loss or 15% gain or momentum greater than 2 whichever came first.
The envelope please - in both instances a 77 day period was used (ending on 11/22) which meant that 77 stocks were picked. Of the stocks that began greater than the EMA 90 the end result was a loss of 183 dollars. Of the stocks that began less than the EMA 90 the end result was a gain of 29831 dollars. Big difference.
Then, for fun, I switch the EMA to a simple moving average using 200 as the base. The end result this time for the less than 200 day moving average was 26484 dollars - a small difference. However, for the greater than 200 day moving average the result was 11632 dollars - which is a big difference.
But in both instances Dr. Brett's experiment is supported - you should have better returns with stocks starting from below a long term moving average than with those starting from above. That is a result of regression to the mean.
If I have the time over the weekend I'll try this with a couple of other moving averages - specifically the EMA 21 and the MA 20. Needless to say I could get really classy and start combining long and short term averages and if I don't get too confused I might try it.
I used Stockfetcher.com for my filtering and backtesting software. Different date ranges and exit settings will necessarily yield different results.
Showing posts with label Moving Averages. Show all posts
Showing posts with label Moving Averages. Show all posts
Friday, November 24, 2006

Monday, November 06, 2006
Regression to the Mean
The one area of TA that I can't fault (aside from pure old supply and demand) is the theory regarding regression to a mean. I've seen it so many times that I know it is the truth - when one average strays far enough away from another average the other average acts as an attractor and pulls it back. The same thing could be said about raw price but raw price is so volatile most often that you will have a difficult time trying to figure it out.
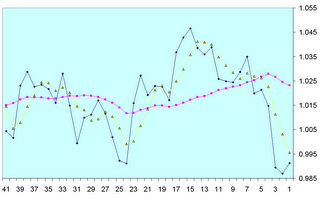
Above is a picture of IWM, the black line is the normalized returns over the period selected, the yellow line is the 4 period average of the black line and the red line is the 20 period average of the black line. You don't have to be a rocket scientist to be able to figure out why IWM closed up on Friday - it was getting too far away from its 20 day average. Now the only problem with that statement is - how far is too far? Well we really don't know - all we can really say is that given 2% difference between averages price is going to react - most of the time. And you can take that to the bank.
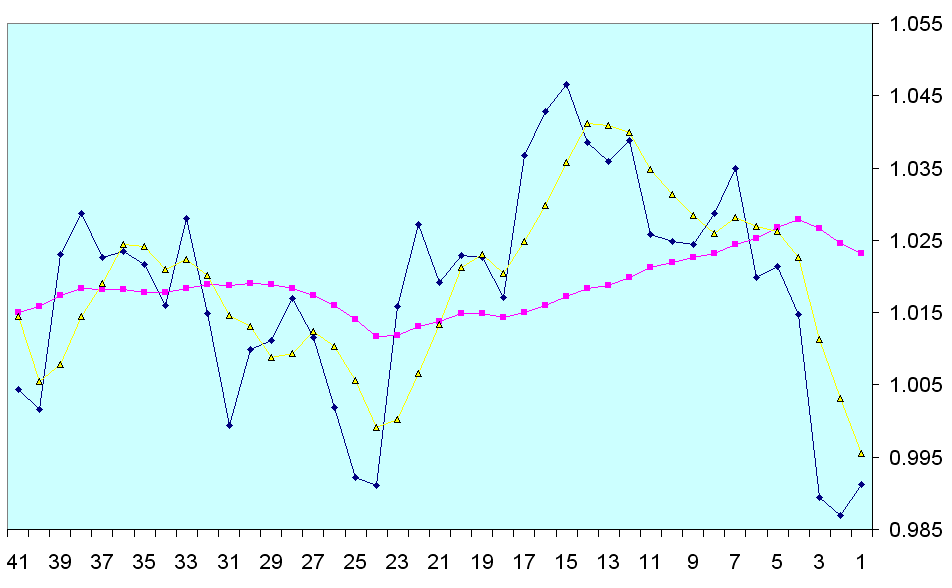
Above is a picture of IWM, the black line is the normalized returns over the period selected, the yellow line is the 4 period average of the black line and the red line is the 20 period average of the black line. You don't have to be a rocket scientist to be able to figure out why IWM closed up on Friday - it was getting too far away from its 20 day average. Now the only problem with that statement is - how far is too far? Well we really don't know - all we can really say is that given 2% difference between averages price is going to react - most of the time. And you can take that to the bank.
Subscribe to:
Posts (Atom)
