Saturday, March 24, 2007

Pray For Rain

I was over on Dogwoods site and it's worth the trip if you haven't been there before and I was looking at a couple of stocks that his filters had output and this one caught my eye -


So I was looking at it and looking at it and saying to myself that its way too late to get into this guy - you would have wanted to get into it back on February 28th - when all of a sudden that date rang a bell. I realized that this stock had gone up and finished up on February 27th and how priceless is that?

So then I started thinking - how many stocks in this class did the same thing and how are they doing today? So I wrote a modified gap up filter that would catch this one and all of its little friends and output them for February 27th and here they are -


And it doesn't take a rocket scientist to see that there was a lot of appreciation out of that class of stocks that day. And the neat thing is all of the losers would have been gone long before they reached their current loss levels.

The really really really interesting thing is that the filter that found this set back tests at a -3% ROI so it is pretty bad most of the time. But give it a good down day in the market and it will find gold.

Moral of the story - pray for rain and harvest the flowers that spring up afterward.

A Tale Of Two Filters

I often switch my filters around to see what happens - for example if I'm requiring a close to be greater than the EMA(140) for example I'll change the filter to require the close to be less than the EMA(140) and back test the two of them to see what the differences are.

I did that this morning with a crossover filter that I've been working on and came up with unexpected results. Here are the two filters side by side - the original one is on the left - the mirror image one is on the right -


And here are the results of the back test -


The crossover pattern is one of many "trader's observations" that I've made over the years and I almost always take a trade with this pattern on any time frame but I usually require that the EMA 4 be above the EMA 21 - it just seemed to me to be a better way to do the deed.

Consequently this morning when I switched the pattern to have the EMA 4 below the EMA 21 and then switched the open/close appropriately I was very surprised to see a better ROI albeit a worse win percentage. The really strange thing was both filters made 41 selections over the same period. I quickly brought up the trades page and reviewed the selections and was relieved to see that they were totally different sets.

Then I changed the test period from the current period 11/06 to 3/06 to the very prolific period 10/06 to 2/06 and the results once again matched the expectations.


This time there were 42 and 43 selections.

Another result that I use frequently is the net change over 30 days and once more the inverted filter (4 < 21) won the challenge. The difficult period was only a few percentage points apart but in the fertile period it had 4.35% to 3.33% advantage. Both of these numbers are respectable but the inverted filter seems to test better in the long term.

The crossover pattern appears to work either way and ultimate results depend on the market conditions which is always the case. If you use the crossover pattern the best place to put your stop is just under the lower of the two moving averages (either EMA 4 or EMA 21) because if its going to fail it will do so almost immediately. I always plan for two or three up days out of this approach and then play it day by day after that.

This is not an invitation to speculate in the stock market - it is a deep, dark, dreary place filled with money eating demons.

For anyone interested in shorting a stock - the crossover pattern works just as well on the dark side as it does on the sunny side - just make appropriate open - close changes.

A Funny Chart Pattern

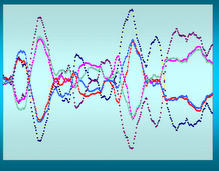
I've never seen this pattern before and haven't a clue what it might signify -


It's almost an "OMG - I bought that piece of Crap!" - "Sell it! Sell it!" - "No! No! - I really wanted it!" kind of a moment. Over and over again.

On the 5-minute charts it looks even funnier because there are gaps and pauses everywhere -


Come on folks - where else you going to get this kind of stuff - over at Ritholz's place - not hardly.

Using BOB as a Day Trade Starter

When I began day trading one of the more difficult problems to solve was finding stocks to trade. I used gap-up and gap-down screens right after market open and these work well but sometimes some of the best trades are neither gap up or gap down.

So I think that that I have solved that problem for good by using the BOB set-up filter to find potential day trades. And had I been at my station Friday instead of beating a white ball around I would have had a beauty – IN.

The BOB set-up filter finds the first two candles of the set-up and then relies on you to find the third candle.

Here is how IN looked on Thursday with the BOB set-up – you can see how the set-up converted to a full BOB on Friday – it opened and went up – i.e. the low of the day Friday was above the low of Thursday. And that is key and critical to a BOB set-up.


The 15-minute chart looked like this so if you didn’t want to take the crossover entry off the BOB set-up you could have taken one of the returns to 4.


Here is how those looked with the pivot points in place. I used the extended pivot points to illustrate this trade.


This chart also has a couple of other interesting features – one is the dummy spot on Thursday coupled with the RSI(2) < 2 and the other, not annotated, is the last three 15-minute candles on Thursday have a BOB, an RSI(2) < 2 and a tweezer bottom all in the same three candle set-up. I never recommend starting a day trade overnight on something like that but it would have lent credence to the next day’s action. And as soon as you saw the crossover you could have taken the trade with confidence.

Say It Ain't So - Jimmy Crack Corn Pone -

Say it ain't so.... and tight on the little dirty face with tears running down the rosy apple-red cheek and fade to black and cut!

Oh please - please - puhhhaleeeez - don't let this happen - no more Cramer to bash around - what will happen to all the poor retail investors out there who follow him like dogs follow their owner when he's carrying a pork chop bone?

I don't know if you've been following all the Bull Snot regarding Jimmy and hedge funds manipulating stock prices for fun and profit - but I haven't. I haven't because if you didn't understand that was going on you are a naive waif and you deserve to have your cookies taken away.

It isn't personal - it's just bidness brudder and it just don't matter.

Somebody, for the past three days, was selling KNOT down - no news, no reason - just relentless selling.


Everytime it caught a bid it was sold down again -


Does that look like panic selling by the retail trade? This is a deliberate effort to sell this stock - as in I don't want your last bid - I will offer it lower, please. Most of the time this sort of selling comes with a story - there wasn't one in this instance or at least one that the clueless ones were fed. Or maybe all of the hot shot financial writers - you know - the guys who write stuff like - buy and hold is the only true way to wealth - maybe they were feeling put upon and refused to write the story.

Can I prove that? Oh hell no. The point is this sort of thing exists - it goes on all the time - everyone in the business knows that it happens - and just about no one - except the clueless financial media - cares.

Because - and this is key and crucial to the whole argument - if they cared they would have made a stink about it in December when Jimmy Crack Corn Pone first sat down and "confessed".

I kid you KNOT.

Friday, March 23, 2007

Wrapping Friday

A good day to miss - my trading portfolio increased in value and the model portfolio increased in value but the benchmark stayed the same. We'll get to the numbers in a bit. According to the radio this was the best week for the DJI in over 4 years. Can a crash be far behind?

I added to OI before I left after it bounced off the pivot point and then it went all the way to R2 before it rested for the day. WEN is becoming a real disappointment and I think I'll have to drop her on Monday. I'll find something else to fill the void this weekend. STD went down 16 cents at the open and pretty much sat there the rest of the day. GGB took a run up to R1, reversed back to pivot point and then closed at R1.

MSFT and AAPL flat lined all day but GOOG sparked a bit in the last hour - don't know what that was all about.

This guy remains overbought but it is slowing down on the advance - you can see that from the bars - yesterday was 0.0251 and today was only 0.0254 - I think it is getting ready to turn - and I think we have a down week overall next week.


The model portfolio is printing 7.14% and the benchmark is at 2.14.

The VIX is drawing back even more towards 10% under the 10-period moving average, the INDU ATR is 129.66 or down a bit more today which is good, and the up/down ratio is 50% or as neutral as you can get.

I'm forecasting Monday as a down day.

Meanwhile, the coin having got it part right again calls Monday ... heads - up day.

Today was yet one more tie - and this is amazing - so that makes the score Marlyn 22 - 18 and 8 and the coin is 22 - 18 and 8. I'll be back this weekend with some more wit and wisdom or at least a few more posts about life, the market, and making money.

If Anyone Asks For Me

Tell them I had a Doctor's appointment -


I'll be in for the open and then out the rest of the day.

Have a great day trading.

Friday - Looking Down-ish

Pre-market the futures are down, Europe is down but coming back, Asia finished up but much like the U.S. market - i.e. low noise level.

The Yen is drifting down - I did want to show you however how you can use the RSI(2) on Yen hourly charts above 95 you short, below 5 you go long - how hard is this?


Do you think I should start my own infomercial and sell training on how to play FOREX? Thanks, but no thanks - I know how difficult it really is. Looks like it is setting up a FOREX BOB right now too.

I did want to mention that the Euro has returned to where it was before the announcement (in relation to the buck) but the Cable is still refusing to acknowledge the fact that there wasn't any fire and it didn't have to really rush out of the house with no pants on ... As I said yesterday - the older currencies are sloooow.

But that's not why we're here right now - right now I want to tell you about this amazing stock - it is a story stock with an idea behind it and best of all it is cheeep! - as in bird seed cheap - and I'm talking about, what else, good old CMGI - OMG - it's back!

After the post the other day in which I heaped scorn and ridicule on radio stock touts who aren't named Jimmy Crack Corn Pone and spoke about CMGI in less than glowing terms - I have now seen at least one more article about it and not only that but it is in the top 10 of European acquisitions overnight. What in the name of all that is holy is going on here?


You can't help but notice how it more or less skipped the Bernake-fest and then caught up again yesterday.

Now I'm not saying that this is a good thing or a bad thing - you know how I love these little cheesy pieces of crap with all my heart and soul but I think I have to put a few shares in the account and close my eyes and forget they're there. Who knows maybe it goes back up to 160 again - yeah, right - more than likely it goes back to 1.60 again.

INTC or AMD

There is a lot of chatter on the net about how INTC is kicking AMD's chip and it is no longer on a price per flop basis but rather a price per chip basis. That's because we have two chip designers who basically have invented the same thing using different methods and the only variance between them, well it used to be advertising but they've given that up in favor of price per chip.

Now they are in full-fledged war trying to garner market share in that good old American way - by buying it. And the way they buy it is by cutting their margins to the bone and telling themselves its for the good of the company.

I got news for you boys - whatever you are doing isn't working and you really should stop it before someone - namely your gazillion shareholders who couldn't give a cowflop about chip efficiency and only care about returns and this is what they see -


My take - skip these two - they are in a death spiral down and neither of them is going to win - why they don't merge is beyond me.

Long QLD or Short QID

This remains the question - Steven asked again and I will do my best to answer -
if in a long situation which would be better - short the QID or go long the QLD?


They are supposed to be mirror images but they are not -


They are close but the problem right now is that there just isn't enough data or experience with these two funds but right now the fact is the QLD has "longer legs" than the QID.

That would suggest that anytime you have an opportunity to buy QLD vs short QID you probably should and vice versa - I.E. if the occasion suggests being long QID you probably should short QLD. As an interesting aside - the actual short interest on QID is nearly 3 times that of QLD - so we need to go to the raw figures to work it out.

Putting aside expenses and fees associated with ETFs and shorting which will change the results a bit this is what I found using 5 different "long market" periods in the past 150 days -
QLD per share total returned 13.50 and short QID per share total returned 10.03.
This bears out the visual above (QLD having "longer legs") and suggests that people who short these two stocks really don't know what they are doing because they are shorting the wrong one.

Again - the sample size is too small to say with any conviction do this or do that. All I can say is that up till now it appears a long purchase of QLD when the market goes up and a short sale of QLD when the market goes down might be the appropriate way to go. A year from now the story may change significantly.

I hope that answers the question and I'm always glad to help out.

Thursday, March 22, 2007

This Is Amazing

Bill Cara actually provided two posts today that I can ridicule - this is better than Christmas and Easter rolled into one.

Cara, if you don't know, is an obnoxious know it all who spends most of the time criticizing the U.S. equity markets - and some of the criticism is well-founded - the problem with Cara is the same as with Ritholz - as with Knight - someday they are going to call the top - after all they call it every day so eventually they are going to be right - wow - I'm impressed. I've got a coin that is more accurate regarding the market than any of these guys. But back to Cara.

In post number one he says that he was invited to write an article for Forbes titled something like - are there too many ETFs? He answers in the affirmative. Now I haven't read the article but I could also say there are too many stocks. Or too many mutual funds. Or too many classes of bonds. Or too many different ways to invest in real estate. But - I only have to invest in what I want to invest in - no one is making me invest in all of those various classes - so, Bill - so f*ing what!

But in post two he really rang my bell. He suggested that the activity of gold ahead of the Fed's announcement suggests (only suggests mind you) that there might be some insider trading going on. What a bunghole - here I am with absolutely none of the sophistication of 99% of the rest of the investment world predicting the Yen correctly. Here is how I did that - the Fed got involved in the markets last week and probably back on Feb 27th by putting a lot of liquidity in the hands of the bankers so they could buy every offer. By buying the offers they keep the market from going down 20% or more at a time. After doing that did you really think that the Fed was going to make any noise that might rile the markets yesterday? Of course not and I wrote that yesterday morning or Tuesday night - I don't remember when. Consequently doesn't it stand to reason if I can figure out such a simple thing then the rest of the world can as well and there might be a whole lot of speculation in gold as a result?

Of course there is - but Cara will never believe it because he is a bunghole - plain and simple. I'm sorry if you are a Cara follower - he is an acquired taste. Like clams, muscles and Bull Snot.

Are You a Value Investor?

If you are - so sorry - I mean value has its place but this is the kind of stock that has value investors salivating -


In fact I just read an article by Geoff Gannon in Seeking Alpha about this company - and he goes on and on and even mentions Bill Rempel as being intrigued with this value investment back in 2005! Look at how much this stock has moved since 2005. Maybe you can tie your money up for that long and longer - I can't.

Just remember just because some Blogger or other thinks XYZ is the bestest stock ever - never put your money on dogs that don't run. I bet a whole bunch of people put their money on this dog back in September and by December they thought they were going to ride it to the moon ---

Man I hate "story stocks" I hate them worse than I hate "idea" stocks and even more than I hate "cheap stocks".

Double Bottom

What is a double bottom? It is the best indicator of an up market anyone can ever find - I'm seeing it in so many stocks lately I can't hardly pick between them.

There are two consistent patterns in stock movement - the "M" and the "W". They look like this -


When you see this and it occurs in every time frame be ready to go long or short the second leg. It is especially potent on the daily or longer time frame charts. And it is a very recognizable pattern. John Bollinger in his book about his famous bands discusses the M's and W's at some length. Japanese candlestick methods also talks about the two mountains (M) and the two rivers (W).

Don't confuse this with triple tops and triple bottoms - these are different beasts all together. The triple top is the head and shoulders formation and the triple bottom is the inverted head and shoulders. The Japanese call them the three Buddhas and three rivers. Any M-W or W-M formation can segue into a triple top or triple bottom - but we are playing the leg not the whole. And that is a problem in description - I'll show what I mean - same stock - different way of drawing the lines


And this is an absolutely perfect head and shoulders formation and if it meant anything this stock should be heading to 12 right now instead of 19. So I should have sold out of GGB when the second shoulder formed - except I don't believe in this formation - in fact it is a very low probability formation. W's and M's on the other hand are high probability.

There's also a lot of mythology built up around the shape of the M or the W - I say that's just to confuse people - stay simple folks, stay simple.

You know I used to believe in all of this Bull Snot - I really did - but I just don't anymore - I've studied the market for so long and so hard that these formations are meaningless - give me a tweezer bottom, a pivot point, a BOB and I'm in the game - start talking to me about head and shoulders and I start checking for dandruff - I also grab my wallet because you aren't getting any of my hard earned money.

Wrappin' Thursday

Boring - I added WEN and OI to the trading portfolio, bulked up STD and added some more to GGB (The amount I would have played on AKS had I added it). That add was at the end of the day. Kicked KNOT out of the portfolio for a nice little loss and I still don't know why the relentless selling continues. WEN actually turned around and went up 20 cents after I bought it. OI was up all day also 20 cents over my purchase price. Given the kind of day it was that seemed to me to be a success.

We didn't even go down - we went sideways - but the INDU Average True Range declined a bit to 133.66 and that is always good. What we are looking for is a steady decline with a steady rise in prices - nothing too violent because the slower it goes up the longer it lasts. Take what you will out of that - I've taken it as far as I'm going to go.

The model portfolio is at 6.74% and the benchmark is 2.03% - the model dropped .11% and the benchmark didn't move.

GOOG was back in play today - did a lovely return to 4, bounced off its pivot point and went past R1 on a lot of nice little moves. It even bounced off midpoint high along the way - if you can chart pivot points take a look at a classic on the 15-minute charts. MSFT took the day off and AAPL gained 8 cents - still a long way to go to get to 100 and it gets longer if its going to do it 8 cents at a clip.

I wish I could tell you that tomorrow was going to be better but I just don't see it - next week however should produce some nice gains again. It's the last week in the quarter and the 12000 funds have to get spiffy so the managers can get their quarterly bonuses - vacation time is coming.

The VIX is coming back to the line - 16% under today. Another day and it will probably make it back over the 10-period moving average. This guy remains overbought but we've been here before -


The up/down ratio is finally breathing a little easier at 45% which is a serious drop from the 70% where it was yesterday. If we could just get a turnaround on the NewMoMo for a day or two we might even set up nice for the end of next week.

I have to follow my instincts and the momentum chart and call tomorrow a down day.

The coin however is calling tomorrow ... heads - up again - once the coin gets an idea in its head its hard to shake it.

We have to call today another tie neither up nor down so the score now stands at Marlyn 21 - 17 and 7 and the coin is 22 - 18 and 7.

Good Thursday

As expected a bit of a rebound after yesterday afternoon. The market needs a little rest and so do the rest of us. I added OI this morning on a jump up and I'm pretty pleased with that. I waited for WEN to both pull back to the pivot point and put the RSI(2) < 2. When it passes back through the pivot point going up I'll add to it.

After pulling back for the first 40 minutes or so my other holdings are turning around and going back up again. I'm going to add to STD once it crosses the pivot point going up (does that sound like a broken record?) and I'm giving KNOT until noon to start looking for the sunlight. It's currently at 23.79 and it has until noon to make 23.99 or else its gone.

OK I've got to go back to work - need to add to WEN and STD.

Update: - AKS - I decided that I have enough steel in GGB and if it continues to rise I'll continue to layer into that one rather than a new one.

Recession Proof Your Portfolio

I love headlines like that - I'm drawn to them like a moth to flame - and when I read the article under them I always come away with the same thought - people actually pay for that kind of advice - where did I go wrong.

TheStreet.com Ratings: Recession-Proof Funds is an article published by Yahoo finance. They go blah blah blah recession blah blah blah and when we're in one here's where you should invest - and they gave a dozen or so utility funds - oh boy oh joy - utility funds.

Of course they start out by saying
If the U.S. economy is really headed for a recession, you'll want to take shelter in investments that are relatively safe and offer steady yields.

"If" - what a wonderful word. Naturally there isn't one word in the article about how to recognize that we are going into a recession or something really useful like that only - if we are really headed for one. Given that the Fed only reports us being in a recession at least 2 quarters after we have been in it you just won't know will you? And people actually pay for this kind of advice - give me a break. Of course my theory as to why people pay for this kind of advice is to absolve them of all blame when their account goes belly up and they're tapped out - "wasn't my fault, Vern, I listened to every word ol' Jimmy Crack Corn Pone said and followed his picks to the letter."

Anyway the article then listed out some of their utility fund picks and I took a couple of their A+ funds and a couple of their A rated funds and ran them through the old mix master and this is what I came up with -


And you tell me which are the A funds and which are the A+ funds. I couldn't tell from returns - but that's not the best part - here's the best part - they are all turning up now - does that mean that we are going into or coming out of a recession?

Here's a tip - the red and the black are the A+, the blue and the green are the A's.

Whata racket. Barnum was only half right.

It's 7 A.M. Do You Know Where the Yen Is?

Right back where it started yesterday at 2 P.M. EDT. I know I know I said it would be back by 4 A.M. - so I'm off by 3 hours I think it was a good call anyway.


Kind of also suggests and up day today in our markets too. But that's not why we're here talking about this - I just wanted anyone who is thinking about trading FOREX to understand the ramifications of a non-announcement out of the Federal Reserve. It means a very profitable round trip if you play it correctly.

But this same thing didn't happen in the Euro or the Cable. The Euro only came half way back and the Cable is still going although it looks like it might be starting to turn now - the older currencies are very slooow. The Aussie buck hasn't turned either - I found when I played them that the Aussie buck pretty much followed the Pound. It was supposed to follow gold but I can guarantee that that wasn't the case.

Marlyn's Trade

A Reader (Steven) asks
When one is feeling long or short on the market is it better to buy the QID/QLD (or the other ultra ETFs they have) or short it?

Example: I think the market is going down I can either buy the QID or short the QLD. Which one is better?


I enjoy these kinds of questions because there is no right answer - there is, of course, Marlyn's answer and that you can take or leave at your discretion.

First there is no right answer. I looked up the short interest for both of these puppy's and was astounded to find that, yes, folks are shorting QID, not much but they do have shorts against a "shorting" ETF. Then I saw that folks are also shorting QLD - again not a lot but the interesting thing is there are three large months that folks are short - Last July, November, and March 2007. I don't know about you but I seem to remember that there was a mini-boom from July to December followed by yet another mini-boom from November through the end of the year - so if we are looking for a contrary signal - have we found it? Only time will tell - but if it turns out the larger than normal short interest in QLD presages a boom - you heard it here first.

Now let's get back to the question. I don't short for the simple reason that I have a working set of tools for the long side, they serve me well and golf season is upon us again. I'd rather take dull or down days off than look for short opportunities so I can bat a little white ball around the course.

But I do like the idea of the QID/QLD as a pair and I took a look at some methods where you would buy them both simultaneously. What? Yes - just like some crafty old hedge fund manager type guy you would buy them proportionally to the direction of the market - I used simple numbers - 5 and 10 - for the demonstration but I'm sure you guys can work on it and get some optimums.

But here's what I did. If my sense was that the market was going up then I bought 10 QLD and 5 QID lots. If I sensed the market was turning I switched the order around. I did this in such a manner that you could get the sense of the market by 3 P.M. of any day and be positioned for the next day before 4. I used NewMoMo but you could use anything - including RSI(2) or ATR(10) or ATR(4) or a set-up or what ever you chose.

Here is a chart going back to 26 December through yesterday of the combined returns using the method above - There were 9 market turns in the period -


Do I recommend this - not on your life buster and if you use it and blow out your account zigging when you should be zagging you didn't hear it here. Actually that's the beauty of the approach - you won't blow out your account.

Now would you make as much as you would if you just went one way and not the other - no - but the method I've proposed is really low risk and if the market takes off in either direction you could always cancel one side of the trade or the other until it settled. Note that the chart reflects the fact that I held both sides through the entire test period.

So think about it - work on it on your own and maybe you will come up with the poor man's magic hedging system. If you do and you start selling it to unwary bystanders and you start making a small fortune off it - remember to call it by it's correct name - Marlyn's Trade.

Wednesday, March 21, 2007

Some For Thursday

First things first - one of my selections from this morning WEN - well right after I posted that it was dropping like a rock it turned from rock to rocket - I didn't pick up on it however (damn head cold) so I missed a good entry. I'm hoping for a pull back tomorrow and I'll go in then.


The entry point was that crossover at 11:15 = that would have got you in at 31.30 or so and with it finishing at 32.13 that wouldn't have been a bad day trade even. That's the third time this week I pulled a chart down and didn't go back to look and missed a good trade.

Two others that I will be entering tomorrow is OI from the breakout filter -


And my old friend AKS which is also looking like it is finally breaking out.


As I said I'm hoping for a pull back tomorrow on these three so I can gain a little more coin on them.

That really speculative stock that I mentioned, ALTH didn't do anything but I really don't expect it to - it's just a spec play and I'm not in it yet.

Marlyn Wraps Wednesday

Anyone who predicted anything different than today's scenario is a moron and should go back to Fed 101 school. The only surprising thing is we actually did get the 120+ points. I told you that the market would be discounting a future rate cut and that's exactly what happened. The Fed couldn't allow the markets to continually see the down side because it is just too expensive for them - they had to pump the market from within. Couple that with the fact that this is an end of quarter for the mutual funds and you can understand everyone's hidden agenda all around. That's enough macro economics for this week - let's get back to trading.

When the market goes up 100 plus points and one of your holdings doesn't participate that's when you pull the pin and that's what happened to MPW. I'm generally bullish on KNOT so I'm keeping it for awhile more - besides I think it will go back up and get me even before I dump out so I'll keep it for another day at least. I'm still not sure who is selling but someone big is dumping out as much as they can. I wish they'd get done. Still it's volume is less than average so maybe it's not so much someone selling as no one buying.

IMCL, one I missed, just paused around 11 to 2 and then took off again. AFFX dropped like a rock for awhile and then took off at the announcement only to drop again shortly thereafter.

The trading portfolio consists of GGB, STD and KNOT at this time. I added to GGB at close. The model portfolio is at 6.85% (since Feb 28th) and the benchmark is 2.03.

Maybe tomorrow I'll have my head in the game and make some good day trades. I missed a couple of real great ones today. I did want to show you this however -


There are at least 4 entry points on this chart starting from yesterday afternoon and continuing through the Fed announcement. I missed 2 and passed on 2 others simply because I couldn't believe it. Next time I'll be a believer. The one yesterday afternoon - you'd have to already be watching IMCL at that time to pick up on that one. The three today however I should have had.

The three amigos (AAPL, GOOG and MSFT) all took advantage of the Fed rally and went up nicely - so did gold and gold miners based on the beating the dollar took this afternoon. I won't go into this to any depth because it really isn't very important but expect everything to come back to normal tomorrow even though the dollar will continue to fall. That's the whole problem with the theory - everything is a one day event even though the economy is a continuous happening. But enough - nobody knows nothing except that the market is now seriously overbought.

This guy is so overbought there is no way out but down -


And the VIX is 23% below its 10-period moving average. These do not bode well for the remainder of the week. I think we'll have a couple of calming days and next week we'll get the end of the month paint job on the mutual funds and all will be well.

The up/down ratio is at 70% which is a very high number. Last time we went over 65% we dropped 6 points the next day and three days later shed over 100. So we are not out of the woods at all my friends - watch your step.

For tomorrow I'm calling a down day.

The coin is calling for ... heads - another up day.

The score now stands at Marlyn 21 - 17 and 6 and the coin after calling today so perfectly is 22 - 18 and 6.

EDIT - Forgot - the INDU ATR went back up today (of course) and that is not a good sign either - it's at 138 even. I'm sticking to my forecast - down tomorrow.