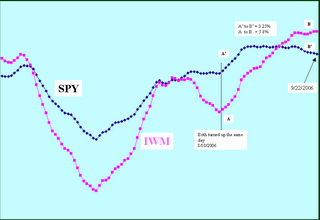
But what is interesting is how they both turned on the same day back in August but since then Small Cap has outperformed Big Cap. Small Cap, of course, has been the leader of this particular Bull Market and this is one thing that the tech worshippers and the Big Cap worshippers can't seem to grasp or understand - it is possible to have a bull market without either of those.
All the necessary information is on the slide. What you are looking at is my proprietary method of making sense out of nonsense called Marlyn's Curve - I've written about that somewhere in here and I'm not about to go find it.

But as always I save the best for last and here is a picture of the Q's with the IWM and the SPX and you can't help but notice that 1 - tech rolled over going up about 7 days before either of the other two and 2 - it has gone higher. In fact over the last 37 days tech has returned 9.2%.

During that period of time I have read numerous BLOGs bewailing the fact that tech is going nowhere, you can't have a market without tech, blah blah blah tech but the proof is in the picture (worth more than a 1000 blogs I might add). And the proof is that those dimbulbs really don't know what they are talking about - but you knew that because you always remember the sacred rule number 1.
One other thing you might care to notice - the Q's recently rolled over going down as has the SPX and the IWM. Be careful for the next couple of weeks or so. Marlyn's curve operates on about a 20 - 30 day cycle and it is suggesting a certain amount of weakness in the market as a whole.

No comments:
Post a Comment