Here are a few of my favorite sites - favorite because they are comprehensive and favorite because they are free - love that word -
Candlesticker - has an extensive set of Bullish, Bearish and Neutral signals.
Daytrader's Bulletin - also has an extensive collection of patterns.
Traders Log has a great section on candlesticks but also a tremendous amount of technical analysis information.
Showing posts with label candlesticks. Show all posts
Showing posts with label candlesticks. Show all posts
Saturday, March 17, 2007

Thursday, January 25, 2007
Thursday's Wrap
Well I mis-called that one. The indicators all pointed solidly down and the market followed the indicators. After my epiphany this morning regarding EBAY's profits I was not surprised. I'm working on a new indicator that looks like it might be better than the old up/down ratio - I have to watch it for awhile and if it proves to be valid I'll include it in the mix.
Bought some KKD just above midpoint low (MPL) and it didn't do anything all day except bounce around the MPL. I'm holding it overnight because the indicators are all solidly up for tomorrow and this time I'll follow the indicators. We'll get to those presently.
One that I missed was BKUNA - I had it on my daily watch list and for some reason or other didn't believe what I was seeing. But it came out of S2 this morning like a shot and went to R1 at the close - my mistake. Here is what that looked like.

You see how you can combine your process (wait for a bottom indicator) with the pivot points in order to make decisions. This one was pretty clear and I really don't know why I missed it except maybe I dozed off for a bit when it was developing.
Day 7 and the dumb traders started shorting GOOG again. Don't they know that Jimmy called for a short squeeze? But in all seriousness - at least as serious as one can be in this business there are some interesting developments in GOOGle-land. One of the sites I frequent, whispernumber.com, is suggesting that the "whisper number" is lower than the analyst estimate for GOOG - by 6 cents. Now we know what kind of havoc 4 cents can bring. If the whisper number (the non-publicised but hardly a secret number) turns out to be correct - look out below on January 31st.
OIH was off again today - some market some inventory a lot of hot air - most of it on the East Coast of the USA. Have no fear oil bulls - summer is coming and I can pretty much guarantee we are going to need a lot of air conditioning and all these old oil fired electric plants are going to be working overtime supplying the juice.
Seeing some chatter about the housing market depression being over and I really think it is. The reason why is because the other day in my morning paper (yes I still get a newspaper - how living in the 50's is that?) in the primary spot (upper right front page) big headline regarding the slump in the housing market. I contend that by the time reality reaches the mainstream media change is already underway. Barry Ritholz disagrees but he said we having a lousy Christmas season and we didn't. Remember rule 1 - nobody knows nothing - including me - and especially in this case since I agreed with Barry.
The up/down ratio is rock bottom at 24% which is more than half of yesterday. The new 20-day high/low ratio is at 39% which is also more than half of yesterday's number. The VIX actually leaped over its 10 day moving average and is now in the yellow zone of oversold territory (+5 - 10%). The DIA, Q'S and IWM all printed white candles in the last hour. GS printed a dummy spot (Doji) and SPY printed a gravestone Doji. Everything signals a bottom. So I'm forecasting an up day tomorrow.
The magic coin having listened to all of the evidence says ... heads - agrees with me.
Marlyn is now 7-5 and 1 and the coin is 5-7 and 1. See you tomorrow.
Bought some KKD just above midpoint low (MPL) and it didn't do anything all day except bounce around the MPL. I'm holding it overnight because the indicators are all solidly up for tomorrow and this time I'll follow the indicators. We'll get to those presently.
One that I missed was BKUNA - I had it on my daily watch list and for some reason or other didn't believe what I was seeing. But it came out of S2 this morning like a shot and went to R1 at the close - my mistake. Here is what that looked like.

You see how you can combine your process (wait for a bottom indicator) with the pivot points in order to make decisions. This one was pretty clear and I really don't know why I missed it except maybe I dozed off for a bit when it was developing.
Day 7 and the dumb traders started shorting GOOG again. Don't they know that Jimmy called for a short squeeze? But in all seriousness - at least as serious as one can be in this business there are some interesting developments in GOOGle-land. One of the sites I frequent, whispernumber.com, is suggesting that the "whisper number" is lower than the analyst estimate for GOOG - by 6 cents. Now we know what kind of havoc 4 cents can bring. If the whisper number (the non-publicised but hardly a secret number) turns out to be correct - look out below on January 31st.
OIH was off again today - some market some inventory a lot of hot air - most of it on the East Coast of the USA. Have no fear oil bulls - summer is coming and I can pretty much guarantee we are going to need a lot of air conditioning and all these old oil fired electric plants are going to be working overtime supplying the juice.
Seeing some chatter about the housing market depression being over and I really think it is. The reason why is because the other day in my morning paper (yes I still get a newspaper - how living in the 50's is that?) in the primary spot (upper right front page) big headline regarding the slump in the housing market. I contend that by the time reality reaches the mainstream media change is already underway. Barry Ritholz disagrees but he said we having a lousy Christmas season and we didn't. Remember rule 1 - nobody knows nothing - including me - and especially in this case since I agreed with Barry.
The up/down ratio is rock bottom at 24% which is more than half of yesterday. The new 20-day high/low ratio is at 39% which is also more than half of yesterday's number. The VIX actually leaped over its 10 day moving average and is now in the yellow zone of oversold territory (+5 - 10%). The DIA, Q'S and IWM all printed white candles in the last hour. GS printed a dummy spot (Doji) and SPY printed a gravestone Doji. Everything signals a bottom. So I'm forecasting an up day tomorrow.
The magic coin having listened to all of the evidence says ... heads - agrees with me.
Marlyn is now 7-5 and 1 and the coin is 5-7 and 1. See you tomorrow.
Sunday, November 19, 2006
Technical Analysis 101
My reader (thanks Mom) wants to know if I remember saying that all technical analysis sucks? – Actually I do but I was talking about all the stuff that is related to manipulating moving averages (and simple moving averages at that) such as rate of change, momentum, and so on. But as I say –just because I don’t like it doesn’t mean I don’t know how to use it.*
My basic problem with most TA is that too many people rely too heavily on it to the exclusion of ever knowing what they are doing. I know this because I was once one of those people. I became a much better trader once I started taking the various programs apart and looking at all of their moving parts. After I did that I began to understand what all these squiggly lines was trying to say. Unfortunately a lot of what they were saying I already knew just by looking at the price patterns and once I realized that - well the rest is history.
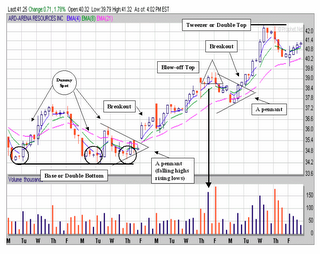
As my reader knows I use a lot of candlestick based TA and I like a breakout from congestion as much as the next guy. Anyway I was looking through some charts this morning in my favorite format, which is 2-hour increments and I came across this one – ARD. A quick glance revealed that it was a veritable clinic in pennants, and dummy spots and tweezer tops and double bottoms and so on. It also had a crisp example of a blow-off top on Thursday before last – which is something you don’t see very often unless you are looking for it.
The blow-off top is characterized by one huge buying push (by volume) followed by a Doji (or what I call a steeple) most often in red followed by a huge volume red candle of any kind. We also had a tweezer top in this particular formation just in case you didn’t get the significance of the rest of it. I call that long necked candle a steeple because in the old days the church steeple was always the highest point in the village and if you think about it – that’s what this signifies.
Anyway for your viewing pleasure complete with markups and everything else you once had to pay for but now can get for free – I give you Technical Analysis 101. (Charts as usual from prophet.net – an excellent site).
One more lesson - if TA is going to work it has to work across all time frames and it must work consistently across all time frames. Much of what passes for TA these days only works well on closing prices and any attempt to use it on a shorter frequency might lead to your early demise as a trader. Be careful.
* (Actually Tom Selleck’s character said it in the movie Quigley Down Under. And he was talking about a .45 caliber wheel gun.)
My basic problem with most TA is that too many people rely too heavily on it to the exclusion of ever knowing what they are doing. I know this because I was once one of those people. I became a much better trader once I started taking the various programs apart and looking at all of their moving parts. After I did that I began to understand what all these squiggly lines was trying to say. Unfortunately a lot of what they were saying I already knew just by looking at the price patterns and once I realized that - well the rest is history.
As my reader knows I use a lot of candlestick based TA and I like a breakout from congestion as much as the next guy. Anyway I was looking through some charts this morning in my favorite format, which is 2-hour increments and I came across this one – ARD. A quick glance revealed that it was a veritable clinic in pennants, and dummy spots and tweezer tops and double bottoms and so on. It also had a crisp example of a blow-off top on Thursday before last – which is something you don’t see very often unless you are looking for it.
The blow-off top is characterized by one huge buying push (by volume) followed by a Doji (or what I call a steeple) most often in red followed by a huge volume red candle of any kind. We also had a tweezer top in this particular formation just in case you didn’t get the significance of the rest of it. I call that long necked candle a steeple because in the old days the church steeple was always the highest point in the village and if you think about it – that’s what this signifies.
Anyway for your viewing pleasure complete with markups and everything else you once had to pay for but now can get for free – I give you Technical Analysis 101. (Charts as usual from prophet.net – an excellent site).

One more lesson - if TA is going to work it has to work across all time frames and it must work consistently across all time frames. Much of what passes for TA these days only works well on closing prices and any attempt to use it on a shorter frequency might lead to your early demise as a trader. Be careful.
* (Actually Tom Selleck’s character said it in the movie Quigley Down Under. And he was talking about a .45 caliber wheel gun.)
Friday, November 17, 2006
Candletricks
Years ago when I first learned about candlesticks I learned how to combine them to make two sticks act as one. A good example of this came up on Wednesday. Here is how SPY looks through Thursday. The candlestick on Wednesday (B) appears to be an inverted hammer which ocassionally suggests a top.

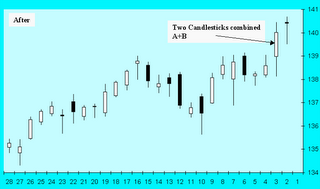
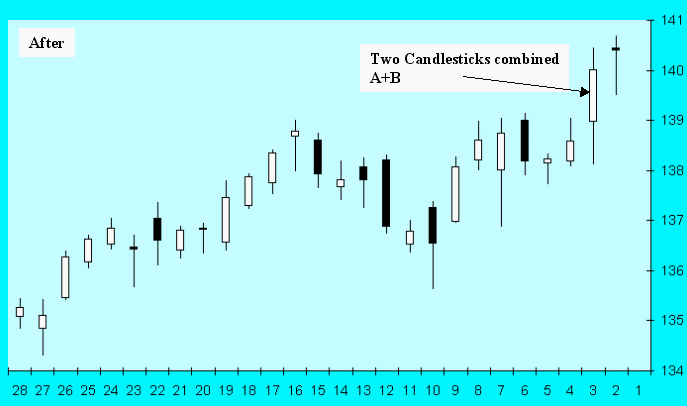
But if you combine Tuesday (A) and Wednesday (B) you get a large spinning top formation which suggests that the market really doesn't know what it wants to do which is obvious from Thursday's action. If you saw it on paper it would look like this -
But of course you would do this in your head, you wouldn't really see it on the page.

But if you combine Tuesday (A) and Wednesday (B) you get a large spinning top formation which suggests that the market really doesn't know what it wants to do which is obvious from Thursday's action. If you saw it on paper it would look like this -
But of course you would do this in your head, you wouldn't really see it on the page.
Tuesday, October 17, 2006
Previewing Tuesday
According to the overnights the futures, the Asians and the Europeans, today is going to be a down day. What this means to me is that there will be a ton of gap downs to choose from and one or two of those will turn and start going up. The best method in this case will be either a two white angel (i.e. the first 30 minutes is up and thus the first two 15 minute candles are both white with a hammer-like appearance) or a three down with a dummy spot. This is a formation that prints 3 red 15 minute candles each one becoming a bit smaller in body length followed by a doji with increasing volume.
In the two white angel format I take the open of the third 15 minute bar. In the three down with a dummy spot I take the next price that exceeds the high of the doji.
We'll see how all of this turns out later but that is what I am looking for in a down market.
In the two white angel format I take the open of the third 15 minute bar. In the three down with a dummy spot I take the next price that exceeds the high of the doji.
We'll see how all of this turns out later but that is what I am looking for in a down market.
Subscribe to:
Posts (Atom)
