Showing posts with label Blow-off Bottom. Show all posts

Friday, April 27, 2007

Some Mods To BOB

When I first began this BLog I did it with one purpose in mind - to share my ideas regarding filters with the general public in the hopes that it would stimulate others to begin thinking about these things and to start looking at new ways of looking at the market.

I think I'm succeeding. Recently I've had several comments directed at possible modifications to the basic BOB and I listen to everything and try as much as I can possibly get to given a limited amount of time and an imagination that is always running wide open.

Anyway the mods proposed were BOB for close above the EMA(90) only and that the volume on the third candle be higher than the volume on the second. So I tested each of these propositions. True to my nature (contrarian always) I tested both above and below EMA(90) and volume higher than 1 day ago and also lower than 1 day ago. I also re-checked the original BOB. The test period was consistent for each test.

The results (drum roll please) ---


I don't make this stuff up - While there is something to be said for each of the modifications in either win percentage or ROI only the original BOB excels in both.

Keep 'em coming guys - sooner or later someone will find the ultimate BOB modification - I just know it.

Saturday, January 13, 2007

Tale of Two Stocks

Today’s lesson, kiddies, is how to recognize a short squeeze on the 15-minute charts and how to recognize the difference between a scalper’s stock and an investment stock.

First I will show you one of the scalpers latest favorite – CRVL. Friday's chart provides an excellent example of a blow-off bottom. The reason why it is a blow-off bottom is because the shorts have to cover. Later in the post we'll show you why the shorts had to cover but once the buyers came out in force and started picking off the offers the stock went up. Because the stock is a low volume trade it can be moved very quickly in price. Consequently the shorts need to move very quickly to ensure their profit. Consequently the price rises rapidly.

If you watch the bid – ask for awhile during one of these buying-selling sprees your head will spin. Occasionally there is a 15 or 20 cent variance. When I want to buy some I put my limit price between the two and it gets hit quickly. I wouldn't use a "market" order in this stock because "market" has no meaning.


Towards the end of the day the day traders start bailing out and the price oscillates with some very large volume - relatively speaking. That is an ideal scalper's stock - low volume and lots of mo-mo. (Mo-mo is a roaring 90's term for "momentum" - I know - so last century).

Compare that to YHOO, which is an investment grade stock. But even in YHOO a blow-off bottom is a blow-off bottom - except in YHOO the volume is in the millions and the price can't be easily manipulated by a handful of snot-nosed kids in their mommy's basement. But the same dynamic applies - traders are short the stock - the market starts moving against them and they have to scurry and cover their bids. Notice too that with YHOO there was no end-of-day bail-out. I will discuss the significance of this at length in a subsequent post this weekend.


You can make money in either one of these stocks - just watch for the blow-off bottoms - if you are careful with CRVL and keep the sharks from eating your lunch you can ride that puppy too.

For those of you who don't want to sift through dozens, hundreds, thousands of charts a day you may simply want to watch the Q's. It too will show the blow-off bottom and when it does you know it is time for a feeding frenzy. So this is what the traders saw occurring Friday at 10:30 - the Q's started to rise - this brought terror into the shortist's hearts and they started to grab every offer in site.

Wednesday, December 06, 2006

Blow-Off Bottom – Again

Being able to pick a bottom in a stock or an index is an amazing skill that should be learned and then honed. Being able to pick a bottom in an hourly format is even more important to a short term trader. And it isn't that difficult to do in this age of information availability.

The chart that I used in the last post – the SPY in hour format just so happened to contain two crystal examples of a blow-off bottom.

There are simple rules for identifying a blow-off bottom. First it must follow a decline of some kind. Second it must be accompanied by larger than usual volume. And, third, it must contain a candlestick that closes in the upper half of its body. If you look at A and B on the chart you will see all of these features annotated.


Practice looking for these in every time frame and you will be rewarded in your trading forever.

Friday, November 17, 2006

Blow-Off Bottom - Again

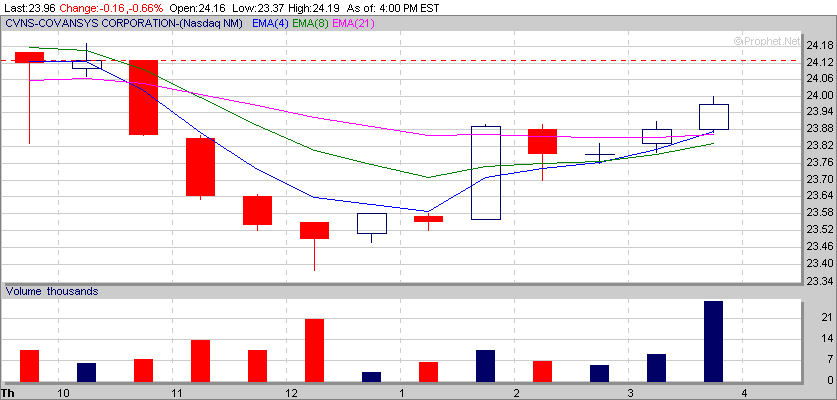
Yet another great example of a blow-off bottom. 30-minute chart of CVNS. I didn't play this one either but it is such a beautiful example I couldn't not show it to you.

Thursday, November 16, 2006

Blow-off Bottom

We've talked about blow-off bottoms before. They happen to be my absolutely favorite kind of trade. First they are extremely obvious on just about any time frame, second, they can occur either on a gap up or a gap down (but more prevalent on gap downs) and third, they result in high probability trades. Here is CVNS - I've played this one before and did not play it today but I was looking through my watch lists after the market closed and this stood out like a sore thumb. This is being played on the 30 minute charts and note what happened with the 6th bar - it formed a high volume red hammer. Unfortunately I wasn't paying attention at the time and didn't see it.


The 30-minute charts provide slow developing set ups that, once established, will last for some time. While you could have picked this up from the 15-minute charts it is more crisp and obvious from the 30's. This is why many of our contemporaries prefer the 30-minute charts.