Showing posts with label AMD. Show all posts

Friday, March 23, 2007

INTC or AMD

There is a lot of chatter on the net about how INTC is kicking AMD's chip and it is no longer on a price per flop basis but rather a price per chip basis. That's because we have two chip designers who basically have invented the same thing using different methods and the only variance between them, well it used to be advertising but they've given that up in favor of price per chip.

Now they are in full-fledged war trying to garner market share in that good old American way - by buying it. And the way they buy it is by cutting their margins to the bone and telling themselves its for the good of the company.

I got news for you boys - whatever you are doing isn't working and you really should stop it before someone - namely your gazillion shareholders who couldn't give a cowflop about chip efficiency and only care about returns and this is what they see -


My take - skip these two - they are in a death spiral down and neither of them is going to win - why they don't merge is beyond me.

Thursday, December 14, 2006

Thursday Wraps

Well I got that one wrong - I really don't know why a couple of thousand fewer people claiming unemployment benefits should have such an impact on the market but it seems to have done the trick. The DIA and the SPY had great set-ups today but the Q's and IWM both gave up after the first hour. I don't like the looks of the Q's because every single hourly candle had a tall neck (or what I call a steeple and you know what the steeples mean - end of trip).

I managed to get out in the fresh air today and play some golf so I didn't do much except dump my ORCL shares at COB. I dumped them for the simple reason that given an NDX run up by 19+ points it round- tripped to dead even. I am now holding some SYMC. I think that I'll close that position tomorrow and in fact go flat through the end of the year. We'll see.

The up/down ratio sits at 56% which is neutral but trending towards the bear. New 20 day highs are up to 811 and new lows are down to 270. These are not good numbers for an upwardly mobile market. The VIX is now 12% below its 10-day moving average and is back in single digits again. The Q's, IWM and GS all printed red candles in the final hour. But DIA and SPY didn't. So a mixed message there. And tomorrow is expiration day. Generally there isn't much volatility on expiration day so I expect tomorrow to be quiet. But you never know.

The magic coin gets to 37 and 27 having hit today square and for tomorrow --- tails - bear market. I think I agree.

Friday, November 24, 2006

Friday Wraps Up Early

Early day - we didn't do much - added a bit to our GM trade from the other day and began a swing trade in AMD - other than that nothing too exciting.

This was a strange day - started out down then went up then went down again. Goldie (GS) kind of set the tone for the whole day - gapped down nearly $2 at the start, went down from there for the first 15 minutes losing another dollar then turned around an went up for the next couple of hours until about 11:15 when it reversed again finally finishing the day off 19 cents. All three sisters, the ugly stepsister and GS, the proxy for the stock market of the 22nd century finished the last hour in the red - which, believe it or not is a good sign. The VIX pulled way back into the neutral zone and the up/down ratio prints 40%. The new 20 day highs pulled back again but remain above 600 at 672 and the new 20 day lows also pulled back to 135. Believe it or not but all these things together suggest not just an up day on Monday but a strong up day to boot.

The magic coin is 33 and 20 having missed today and for Monday says ... heads - bull market - well we think so too.

Saturday, November 11, 2006

2 Hour Swing Trade Finder

People who trade for a living know that the day is roughly broken up to the morning session, lunch session, and afternoon session and they are roughly two hour segments. Trading in each segment varies enough that major changes can occur as far as market dynamics but that is a post for another day. I want to talk about using 2-hour charts to inform high probability swing trades.

Many times when you find a trade from a 2-hour chart it can be used for several days running thus it makes a good swing trade finder as well. The two hours go like this 9:30 – 11:30, 11:30 – 1:30, 1:30 – 3:30 and 3:30 to 4. What? - I hear you scream – yes Virginia there are only three 2-hour periods in any given day and the last “2-hour” period is only a half-hour. That’s why the last period is of so much importance – it is the time that is used for book squaring.

If relentless selling continues during that final half-hour of the day you can be pretty sure you are going to have an up day the next day. That’s because the first time the stock shows any change all of those late sellers are going to come flying back. Those late sellers are what we in the business call “suckerfish.” They are either getting out of losing positions or making late day short sales hoping to scalp an overnight gap down. In either instance they are going to be eager to reacquire if they see any movement at all in an upward direction. This is an automatic profit if you are in quick enough.

However, in the other instance where there is evidence that the selling is drying up, I.E. either a dummy spot or NR7 there is a good possibility that the stock will not only go up the next day but also continue to go up over several days. This effect is enhanced if the market at large is also going up during the same period.

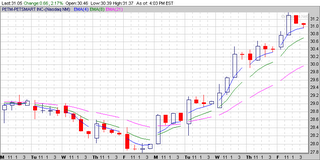
Here then are five charts that you could possibly use as models for future swing trade set-ups.

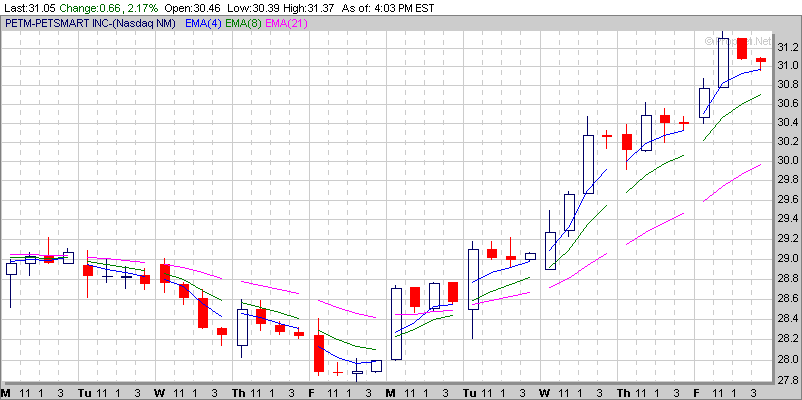
PETM actually bottomed in the second 2-hour trading period, which is indicated by that very clear dummy spot, followed by the doji, which is then followed by confirmation.


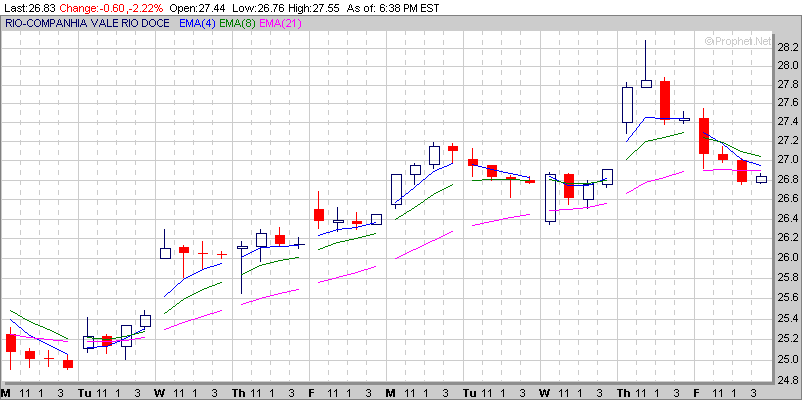
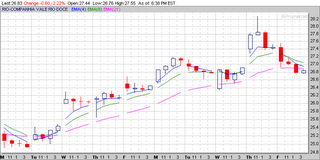
RIO also has a dummy spot this one in the third 2-hour period which is then followed by some suckerfish action which is then scared p-less by the next day’s gap up.


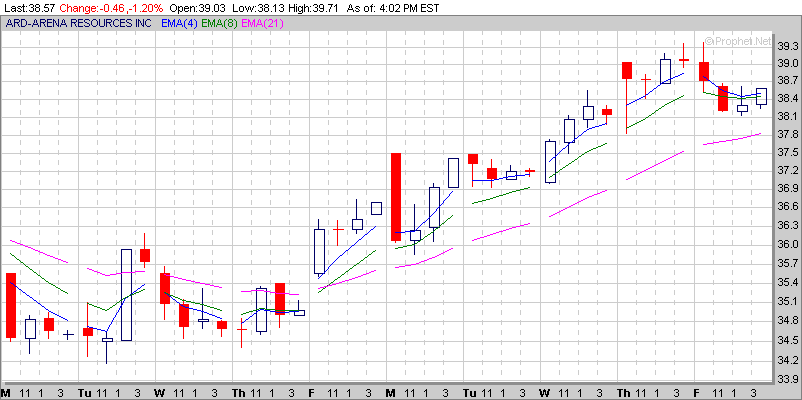
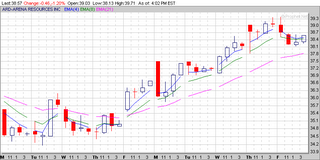
ARD, despite what you might think, only really has the one entry which is the NR7 shown in the first 2-hour period after the relentless selling that went on in the third day in the picture. Remember we always wait for a confirmation before committing funds and there was no confirmation until the candle following that NR7.


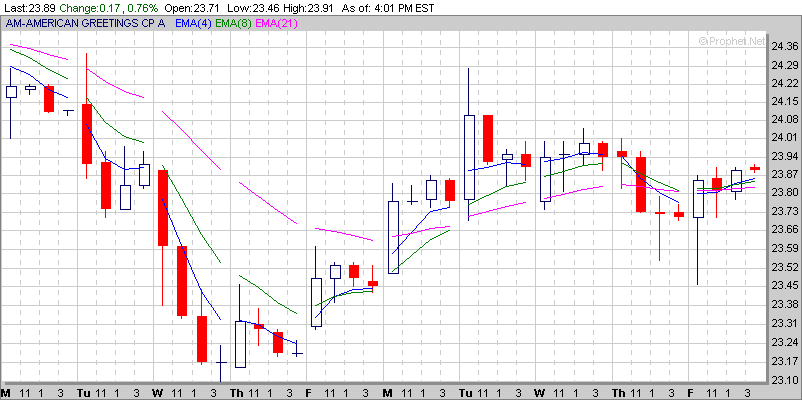
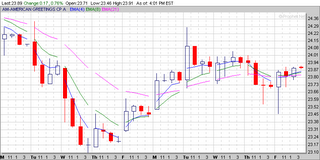
AM throws off a dummy spot with a confirmation (third and fourth days pictured) While some selling goes on if you have a stop it should be below the dummy spot on the third day and that is never taken out. The AM trade isn’t finished yet although a lot of folks would have gotten out after that steeple on Tuesday’s first 2-hour period.


MLS, not only is this a builder but it is a builder of malls and the worst kind of those, mega-malls. Again there was relentless selling including some suckerfish selling on the third day. Imagine the panic when the stock turned around the next day. Obviously a good place to buy since a lot of shorts had to cover. Note the obvious exit at the peak dummy spot on Monday. Next day confirms and you are out.
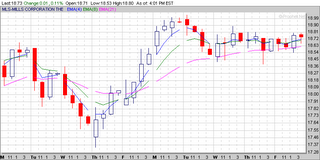


And that's how it is done. Again you always trade at your own risk - what I show here are examples only and are not to be taken as guarantees.

Thursday, November 02, 2006

Wrapping Thursday

Missed most of today - thank God - but did play AMD for a brief time this morning - lost a dime and HANS for an hour or so and made 50 cents. I played AMD off a two white candle formation and it went one more increment and I thought, based on shaky price action, that I should sell it then but didn't - consequently the dime loss. HANS I played off the white hammer in the first 15 minute candle. The next candle was a red spinning top which generally means wait a minute I'm thinking and this was then followed by a white candle where I took the trade. I was out about the high of the day but I didn't know that until this afternoon when I returned to the office.

Tomorrow is shaping up to be an up day - the three sisters all finished with white candles in the last hour and the VIX is back in neutral territory. The up/down ratio still stays bullish at 36% and the new 20 day highs lost some more to 333 but the new 20 day lows put on over a 100 to 715. The last time the new 20 day lows were over 700 was over 60 days and 10 SPY points ago. Another thing is that the end of the month checks will have been in the process for over 3 days which means that they are now cleared for investment purposes and the funds can start buying everything in sight.

Magic coin is 26 and 12 having nailed today even though it wasn't so much a bear day as a pause. But I'll give him his due and put another in his win column. For tomorrow he says - heads - the bull is back - I agree.

I'll be back tomorrow morning with another screen shot of the IWM and friends and we will see what Marlyn's Curve thinks about all of this.