What a bad day. I took a loss today on TLAB. Shouldn't have but I did. Shouldn't have even purchased it in the first place. Don't even know why I did. That was just stupid.
Anyway I was wrong again - you'll never go broke fading my predictions. For tomorrow - who knows. New 20 day high/low sits at 960 to 159 - still nothing to buy low and sell high. The up/down ratio sits at 50% which I would call neutral and all three sisters finished with strong and I mean really strong red candles.
Four of my targets went up and four went down - I had none of them - I bought TLAB instead - dumb dumb dumb.
Oh well - maybe we can get through September in one piece. One more day like today and I'm going to take off until October. Probably not.
No targets for tomorrow yet - maybe later.
Thursday, August 31, 2006

Small Cap Large Cap Green Cap Blue Cap
My reader, thanks Mom, wanted to know where she should put her fund (rich people have funds Mom has fund) small cap or large cap.
Which is leading? Is there a rotation to large cap? What a stupid thing to discuss yet crapvision spends a lot of what otherwise could be productive dead-air time discussing it. And they bring in a lot of high priced airheads to add to the discussion. Of course at the end of the story all they add is general confusion – which is what they are supposed to do. Confusion generates commissions and Wall Street lives on commissions. That and selling high to you what they bought low from you last week.
Well old Marlyn to the rescue folks – no need to worry – no need for dismay – what you are about to see is that one’s about as good as another – in the long run.
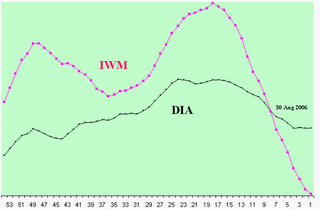
Here, using my proprietary method for comparing apples to oranges, are two charts. The longer one is the last 290 weeks of the DIA (black line) overlaid on the IWM (red line). The short one is for the past year.
For those of you who are still in the first stages of your investing education the DIA is an exchange traded fund (ETF) that represents the Dow Industrials and the IWM is an ETF that represents the Russell 2000, or small cap index. What you are looking at is what I call “Marlyn’s Curve”.
Notice that there was a bear market dip back in Nov 2001 in which both indices participated about equally. But the large caps, as represented by the DIA, led the way out. Notice that the huge, end-of-the-last-bear market in 2002 was led by the DIA (around week 232 or so) and that the IWM quickly followed. Also notice that while the DIA doesn’t achieve the lofty heights of the IWM it also doesn’t plumb the depths with its little brother either.
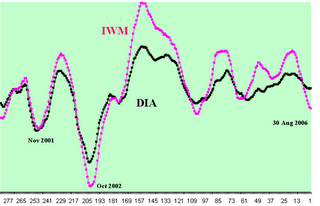
Most importantly in almost every instance the DIA leads both down and up. It occurs to me just looking at this that I’d rather be in large caps on a decline and small caps on a rise – but that’s just me. I have a low tolerance for losses.
The second chart is just a blow up of the last 54 weeks of the chart above. Notice how the high flying small caps have been going great guns until about 23 weeks ago when the large caps suddenly started developing some problems. Notice how the small caps began their plunge and how quickly they descended. About 8 weeks ago they passed the large caps on the way down and, guess what, you better have rotated into large caps at that time or you’re in big trouble – aren’t you.
I’ll let you know when you should go back into small cap. Or maybe you can just watch crapvision I'm sure they know what they're talking about.
Which is leading? Is there a rotation to large cap? What a stupid thing to discuss yet crapvision spends a lot of what otherwise could be productive dead-air time discussing it. And they bring in a lot of high priced airheads to add to the discussion. Of course at the end of the story all they add is general confusion – which is what they are supposed to do. Confusion generates commissions and Wall Street lives on commissions. That and selling high to you what they bought low from you last week.
Well old Marlyn to the rescue folks – no need to worry – no need for dismay – what you are about to see is that one’s about as good as another – in the long run.
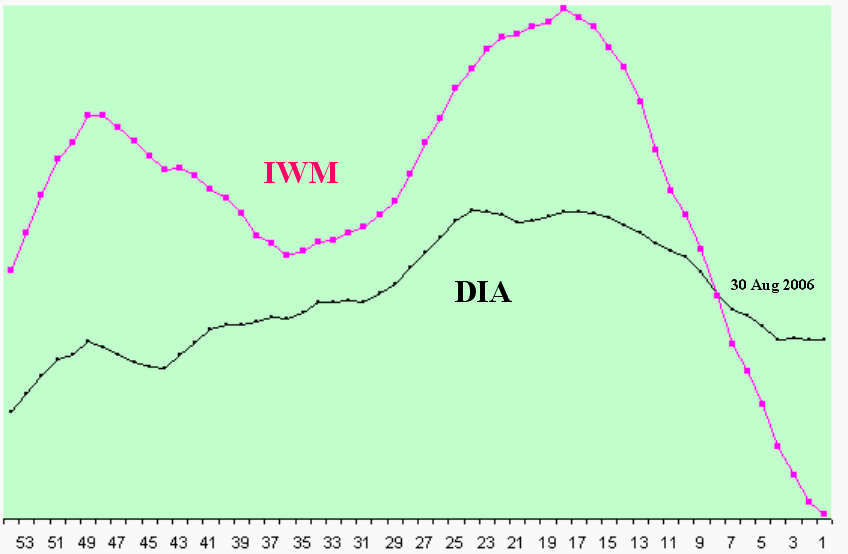
Here, using my proprietary method for comparing apples to oranges, are two charts. The longer one is the last 290 weeks of the DIA (black line) overlaid on the IWM (red line). The short one is for the past year.
For those of you who are still in the first stages of your investing education the DIA is an exchange traded fund (ETF) that represents the Dow Industrials and the IWM is an ETF that represents the Russell 2000, or small cap index. What you are looking at is what I call “Marlyn’s Curve”.
Notice that there was a bear market dip back in Nov 2001 in which both indices participated about equally. But the large caps, as represented by the DIA, led the way out. Notice that the huge, end-of-the-last-bear market in 2002 was led by the DIA (around week 232 or so) and that the IWM quickly followed. Also notice that while the DIA doesn’t achieve the lofty heights of the IWM it also doesn’t plumb the depths with its little brother either.
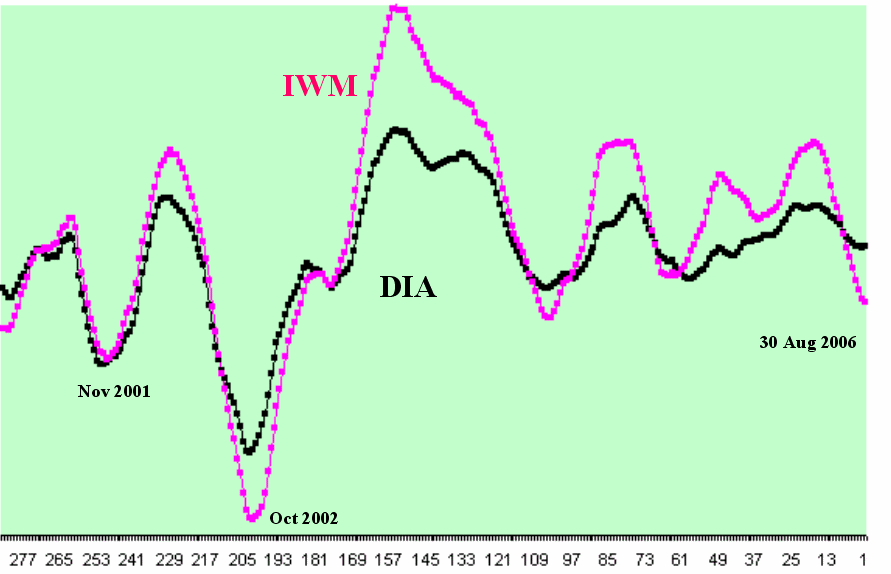
Most importantly in almost every instance the DIA leads both down and up. It occurs to me just looking at this that I’d rather be in large caps on a decline and small caps on a rise – but that’s just me. I have a low tolerance for losses.
The second chart is just a blow up of the last 54 weeks of the chart above. Notice how the high flying small caps have been going great guns until about 23 weeks ago when the large caps suddenly started developing some problems. Notice how the small caps began their plunge and how quickly they descended. About 8 weeks ago they passed the large caps on the way down and, guess what, you better have rotated into large caps at that time or you’re in big trouble – aren’t you.
I’ll let you know when you should go back into small cap. Or maybe you can just watch crapvision I'm sure they know what they're talking about.
Wednesday, August 30, 2006
Wednesday
A fair to good day. I dropped PALM because good news caused the bottom to fall out of the stock and I decided that there was no interest from an institutional standpoint and therefore no appreciation for me. I'm probably wrong but true to my nature I won't look back nor will I weep if it rockets tomorrow.
Held INTC again overnight as I still believe tech is the place to be and what better place than the Grand Dame of the chip makers?
All of the sisters finished with a red candle but the Q's were weak even though the DIA and the SPY were strong. I think this reflects the fact that the week is ending and most if not all of the trading will be completed by noon tomorrow.
The up/down ratio sits at 65% which is a negative factor, the VIX remains neutral and the new 20 day high vs 20 day low numbers are 1106 to 171 which is awful if you are a bull looking for something to buy.
I took small positions in BEAS, CBG and NITE today and made small money in all of them. Better than a loss.
Targets for tomorrow include DHI, PSPT, BEAS, JNPR, INTC, EBAY, AMAT, GLW, and RMBS. One or more of these will be purchased if a set up presents. Otherwise I will work the gap up/gap down lists and my permanant lists and see what obtains.
Held INTC again overnight as I still believe tech is the place to be and what better place than the Grand Dame of the chip makers?
All of the sisters finished with a red candle but the Q's were weak even though the DIA and the SPY were strong. I think this reflects the fact that the week is ending and most if not all of the trading will be completed by noon tomorrow.
The up/down ratio sits at 65% which is a negative factor, the VIX remains neutral and the new 20 day high vs 20 day low numbers are 1106 to 171 which is awful if you are a bull looking for something to buy.
I took small positions in BEAS, CBG and NITE today and made small money in all of them. Better than a loss.
Targets for tomorrow include DHI, PSPT, BEAS, JNPR, INTC, EBAY, AMAT, GLW, and RMBS. One or more of these will be purchased if a set up presents. Otherwise I will work the gap up/gap down lists and my permanant lists and see what obtains.
Why Is the Market Rising?
An annoying question to be sure but let's review the bidding. The market has been going up for the past several years on the strength of the energy and housing sectors kind of dragging everything else along with them. That's because energy and housing as industries cross a whole slew of other sectors in a huge way. Don't believe me - you can't build a house without a nail you can't make a nail without energy. If energy costs go up - nail costs go up - house costs go up. While profits at the nail makers don't go up they at least don't go down as long as there is a huge nail market out there (i.e. housing).
In the meantime all of the so-called and self-proclaimed market professionals are crying about tech this and tech that and you can't have a bull market without tech. But we did.
Now energy and housing are taking a breather and, guess what, suppressed tech, forgotten tech, you can't have a blah blah without it tech is coming into the picture.
The cheapest stocks in any sector is in tech. So what do you think is going to happen? That's right funds are rotating out of energy and housing and into tech.
So where should you put your money?
In the meantime all of the so-called and self-proclaimed market professionals are crying about tech this and tech that and you can't have a bull market without tech. But we did.
Now energy and housing are taking a breather and, guess what, suppressed tech, forgotten tech, you can't have a blah blah without it tech is coming into the picture.
The cheapest stocks in any sector is in tech. So what do you think is going to happen? That's right funds are rotating out of energy and housing and into tech.
So where should you put your money?
Wednesday Targets
The environment is target rich all of a sudden. I will be watching these on Wednesday - INTC, SYMC, TLAB, CBG, CC, CSCO, LSI and DELL. I hold a position in INTC but I will add to it if I think that I see it continuing its run. The rest I will daytrade if they set up correctly.
The Importance of Watching VIX
There is a lot of misinformation out there and the novice trader has to be careful which guru he or she chooses to follow. As pointed out in this Blog we are not in a Bear market but the rumors persist.
One of the more important tools you can use in your daily trading is the VIX on a short period basis. I like setting it up as a 4-minute chart but there can be other preferences. Today for instance (August 29, 2006) began with the VIX gapping up then sidestepping into the EMA 4. It arrived at that juncture a few minutes before 10 and then took off for its highs of the day. Right after 11 it began to roll over, probably from exhaustion and then caught its second wind about 11:30. At 11:45 or so it printed an obvious topping formation and then began sinking until about 12:45. Once more it gained some steam and continued to rise until 2 P.M. when the Fed minutes were released. It then collapsed immediately.
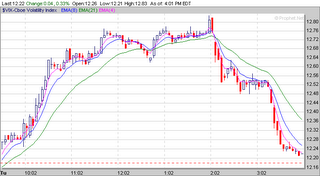
Why is this important? Because if you look at the SPY chart you can see clearly that the SPY tracks the VIX on the other side. Thus if you were watching the VIX you would have seen the market reversal clearly coming by noon based on the clear bottoming formation at 11:45. And you could have repositioned your trades accordingly.

The reason why I say that you have to watch out for so-called gurus is because there are people out there right this minute who are in positions of responsibility and trust who will say - "you can't trust the VIX anymore." But you can see with your own eyes that you can. So who you gonna trust...them or your own lying eyes? Trust yourself - always.
One of the more important tools you can use in your daily trading is the VIX on a short period basis. I like setting it up as a 4-minute chart but there can be other preferences. Today for instance (August 29, 2006) began with the VIX gapping up then sidestepping into the EMA 4. It arrived at that juncture a few minutes before 10 and then took off for its highs of the day. Right after 11 it began to roll over, probably from exhaustion and then caught its second wind about 11:30. At 11:45 or so it printed an obvious topping formation and then began sinking until about 12:45. Once more it gained some steam and continued to rise until 2 P.M. when the Fed minutes were released. It then collapsed immediately.

Why is this important? Because if you look at the SPY chart you can see clearly that the SPY tracks the VIX on the other side. Thus if you were watching the VIX you would have seen the market reversal clearly coming by noon based on the clear bottoming formation at 11:45. And you could have repositioned your trades accordingly.

The reason why I say that you have to watch out for so-called gurus is because there are people out there right this minute who are in positions of responsibility and trust who will say - "you can't trust the VIX anymore." But you can see with your own eyes that you can. So who you gonna trust...them or your own lying eyes? Trust yourself - always.
Tuesday, August 29, 2006
Tuesday
Interesting day. I missed the second half but that was OK because I hold a position in INTC and PALM and intend on holding them for awhile. Both went up just like just about everything else this afternoon.
Now that wasn't really a surprise and later I'll post again and explain what I am talking about. For now we should probably expect more of the same tomorrow - that is - total chaos and confusion.
The DIA and SPY finished the last hour in the red and the QQQQ finished strong white. The VIX remains in neutral territory and the up/down ratio actually came down from yesterday to 58% while the new 20 day high/low stats stand at 1030 to 154. There is no way this market can keep going up under all of this pressure and I think it will go up tomorrow and Thursday (end of month stuff by the funds) and Friday, because most of the traders will be going to the beach it will come down.
Now that wasn't really a surprise and later I'll post again and explain what I am talking about. For now we should probably expect more of the same tomorrow - that is - total chaos and confusion.
The DIA and SPY finished the last hour in the red and the QQQQ finished strong white. The VIX remains in neutral territory and the up/down ratio actually came down from yesterday to 58% while the new 20 day high/low stats stand at 1030 to 154. There is no way this market can keep going up under all of this pressure and I think it will go up tomorrow and Thursday (end of month stuff by the funds) and Friday, because most of the traders will be going to the beach it will come down.
Monday, August 28, 2006
Monday
A good day. I played INTC off my targets list. Didn't get much but a win is a win.
Of the others, GM, SGP (typo'd to SCP on Sunday night), KR, SYMC, VRSN and WMB all went up but only by nickles and dimes. Not really worth the time or effort.
Tomorrow should see a down day. The three sisters all closed the last 2 hours in the red. The new 20 day highs vs lows printed 739 to 185 and the up/down ratio sits at 61%.
The VIX stays neutral but volatility as a whole is down which is what makes trading at least on a daily level pretty bad. No volatility no price movement no big run no big profit.
Targets for tomorrow will include AIRM, ATHR, AVT, AXS, MAT, and ORB.
Of the others, GM, SGP (typo'd to SCP on Sunday night), KR, SYMC, VRSN and WMB all went up but only by nickles and dimes. Not really worth the time or effort.
Tomorrow should see a down day. The three sisters all closed the last 2 hours in the red. The new 20 day highs vs lows printed 739 to 185 and the up/down ratio sits at 61%.
The VIX stays neutral but volatility as a whole is down which is what makes trading at least on a daily level pretty bad. No volatility no price movement no big run no big profit.
Targets for tomorrow will include AIRM, ATHR, AVT, AXS, MAT, and ORB.
Sunday, August 27, 2006
Monday Targets
I'm going to try something new - I'm going to post some of my targets for the next day the day or evening before. Remember these are day trades only unless I specify differently.
For Monday then I will be watching INTC, GM and SCP for an early breakout higher (regardless of market direction).
My secondary list includes KR, SYMC, VRSN and WMB.
For Monday then I will be watching INTC, GM and SCP for an early breakout higher (regardless of market direction).
My secondary list includes KR, SYMC, VRSN and WMB.
Saturday, August 26, 2006
Volume Over Long Periods
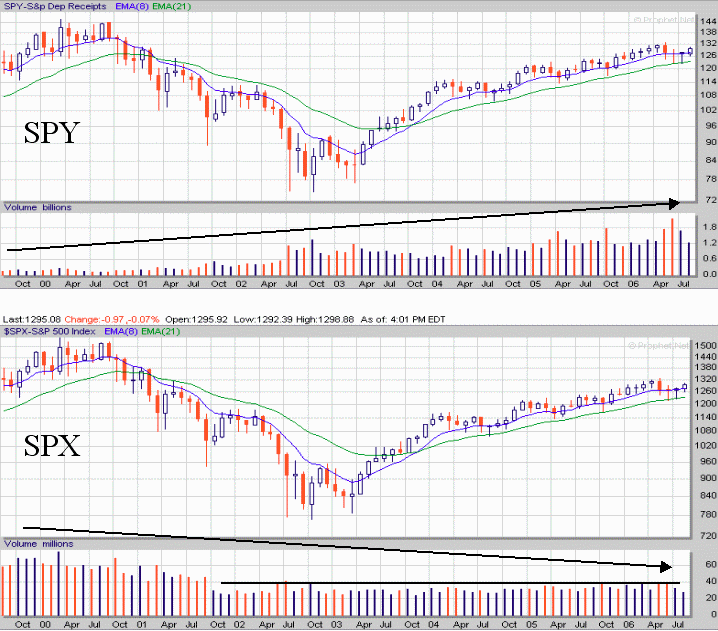
I've said it before - volume might be important right now to indicate market psychology (and I believe it is) but over long periods of time, such as monthly, it isn't of much value. If it were then we would expect to see it in a relationship with advances and declines and what we see is something entirely different. Here are two views of the the S&P 500 - the index (SPX) and the ETF (SPY) on a monthly basis over the same period of time. You be the judge.
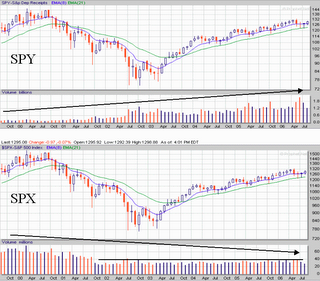
Note that voluem in the SPX began to decline towards the end of '02 about the same time that volume in SPY began to increase. The index volume then leveled off while the ETF volume began growing.
What can we say about that? Simple the ETF is gaining in popularity as an investment vehicle. But there are some subtleties you should notice. First the volume relationship from month to month remains consistent between the two charts. That is when one increases from one month to the next the other does as well.
Other things to notice - the highest volume month in the SPY just occurred in June. But the SPX had a higher volume point in May. One other point of comparison is the fact that while there was a tremendous amount of volume in June for both the index and the ETF they both printed a doji. In this instance I think that means that while the volume may be shown in red a tremendous amount of it was used to push both series up off the EMA 21. And indeed the second week in June was mostly pushing back from the 1220 line. You can look it up.
But regardless of the volume spikes which might or might not tell a story the most important thing to notice is just how consistent from month to month the volume remains. And that is my point. Volume is only part of the story and a very small part of it. The more important part of the story is price and how volatile it is.
I also find it extremely interesting to note how the ETF was used to buy the market out of its last depression. And that is the real tale of the volume - so far.
Note that voluem in the SPX began to decline towards the end of '02 about the same time that volume in SPY began to increase. The index volume then leveled off while the ETF volume began growing.
What can we say about that? Simple the ETF is gaining in popularity as an investment vehicle. But there are some subtleties you should notice. First the volume relationship from month to month remains consistent between the two charts. That is when one increases from one month to the next the other does as well.
Other things to notice - the highest volume month in the SPY just occurred in June. But the SPX had a higher volume point in May. One other point of comparison is the fact that while there was a tremendous amount of volume in June for both the index and the ETF they both printed a doji. In this instance I think that means that while the volume may be shown in red a tremendous amount of it was used to push both series up off the EMA 21. And indeed the second week in June was mostly pushing back from the 1220 line. You can look it up.
But regardless of the volume spikes which might or might not tell a story the most important thing to notice is just how consistent from month to month the volume remains. And that is my point. Volume is only part of the story and a very small part of it. The more important part of the story is price and how volatile it is.
I also find it extremely interesting to note how the ETF was used to buy the market out of its last depression. And that is the real tale of the volume - so far.
A Lot of Bear Talk Going Around
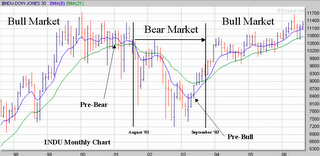
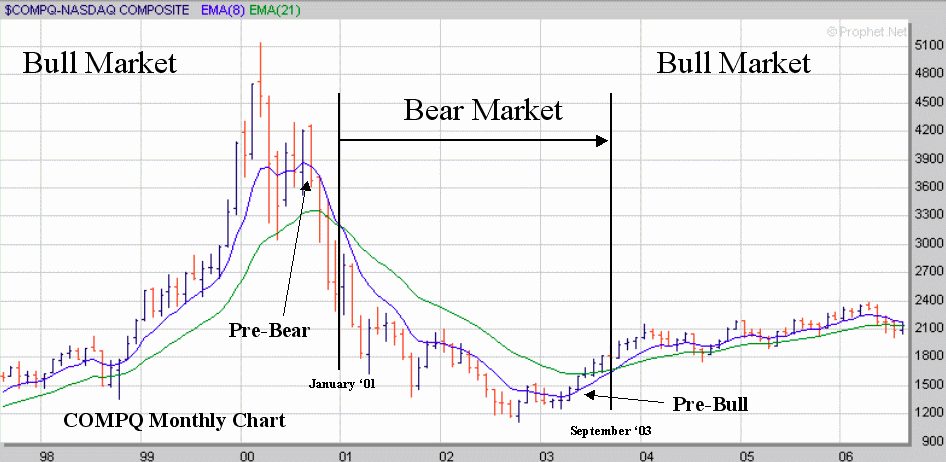
I'm getting fed up with all of the “Bear Market” talk that is going around. You can’t throw a rock without hitting a perma-bear and most of these folks don’t even know what a bear market looks like – they think a few stocks going down makes a bear market. Or, conversely, a few stocks making new highs makes a bear market. That’s just bull snot - to coin a term. I won’t name names they know who they are and they’re just wrong. Here are six charts – examine them closely – see how hard it is to tell when it is a Bear market. I’ve annotated them for you “Bull” and “Bear” – think you can see the difference?
Let’s start with the COMPQ or the NASDAQ chart. Everyone says that in order to have a Bull market tech must lead. That’s just more bull snot. We’ve been in a bull market for almost three years and guess what – small caps led (see RUT chart later) – tech just lollygagged along bringing up the rear. Here is how you know that you are in a full blown Bear market. First you stop looking at daily charts or even weekly charts – for global market direction you need the monthly charts. Second put away your Fibonacci arcs or your Elliot Waves or any other juju you want to use and get a real indicator such as an 8 EMA overlaid on a 21 EMA. Then observe the 8 EMA in relationship to the 21 EMA. See how it flattened out through ‘00 and then rolled over and began converging on the 21 – that’s what I call a pre-Bear market indicator. But the most important thing to notice is that the 8 EMA is some distance away from the 21 EMA (regression to mean guys love this concept) and then it (the EMA 8) flattens and then it converges on the 21. Notice that there is a huge amount of volatility in the bars that are shown in the pre-Bear phase. Then when the 8 EMA finally drops below the 21 EMA we are in a full fledged Bear market. Notice what happens 18 months later. The volatility totally dries up and the 8 EMA turns back up towards the 21 EMA. This is the signal for a pre-Bull market. Six months later the 8 EMA crosses the 21 and off we go again. In this aspect volatility is the excursion from high to low on a monthly basis. Note carefully that I don’t have one bit of volume shown on the charts. That’s because volume might be an indicator of immediate concern (i.e. last 5 minutes or so) but on a large-scale basis it is bogus. If you don’t believe me that’s fine - I’ll do a volume post later this weekend to show you what I’m talking about. If after that you still don’t believe me – well that’s your problem, not mine.
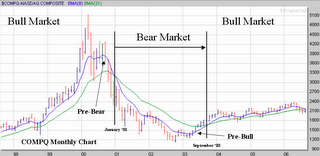
The INDU presents a similar pattern just begins to flatten a lot earlier and rolls over and crosses a lot later. Then when the volatility begins to dry up it finally turns north again (about the same time as the COMPQ) and rolls over up on its way back into Bull territory.
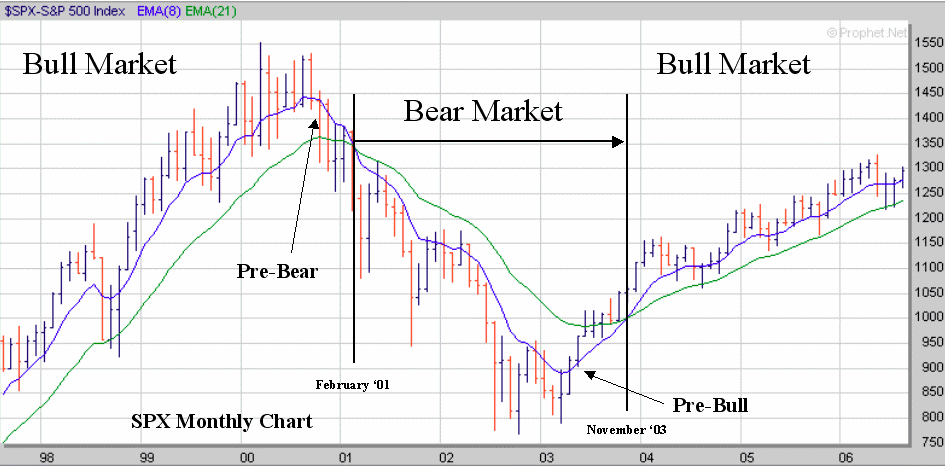
But regardless of the COMPQ and the INDU the real index to watch for a Bull or Bear market is the SPX. Why? Simple – it includes the INDU and the important parts of the COMPQ and is 30% financial and without financial you don’t have a “market”. Notice again the same pattern as seen before – an increase in volatility, a flattening, a roll over, a cross below, a drop, a decrease in volatility, a roll over up and finally a crossing going up. February 2001 to November 2003.

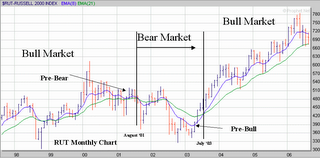
The next chart is the RUT or small cap index. You can discern the same pattern again – an EMA 8 running away from the EMA 21 with increasing volatility – roll over and drop till finally the volatility runs dry and there is another roll over and up it goes. Note carefully that it led us out of the last Bear market – not the tech. In fact tech has gone nowhere in years. Notice the period in ’98-99 where we had a pre-bear – not! No volatility increase is noted. That was a consolidation, nothing more. You see the same effect on all four charts but only the RUT EMA 8 actually touched the EMA 21. What the RUT chart shows you is even if you have a Bear market in the majors you can always find a Bull in the juniors.
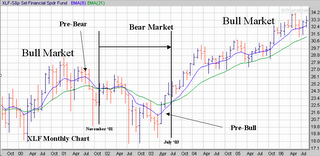
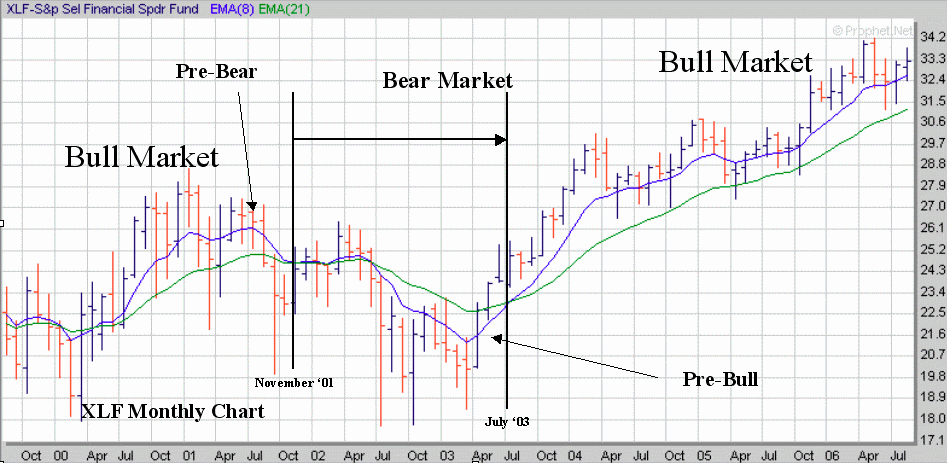
Speaking of financials here is the XLF chart. I’ve annotated it but I’m fairly sure that you can see the Bear and Bull market aspects clearly by now. Note that the current period doesn’t seem to be showing any Bear tracks.
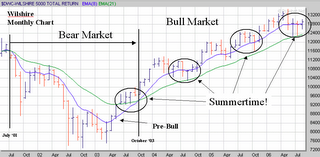
Finally I give you the Wilshire 5000. I’m thinking that this index will become the defacto market indicator of the future. It was released just before the last Bear market began which was convenient for this post. The most import fact regarding the 5000 (not just the annotated Bull and Bear aspects) are the four areas I’ve circled and annotated as “summertime”. June, July, August, and September are obviously the flat months over the past 4 years. Interestingly enough it is always in these months that the Bear talk reaches its annual crescendo.
So – with all of those pictures annotated as they are - can anyone see the same pattern appearing currently in any of the three major indices shown? No – very good. How about in the RUT or the XLF or the Wilshire 5000? Still no – excellent. Now why would that be? Everyone who guessed: ‘because we are not in a bear market’; can stay after school and clean the erasers. The rest of you and you know who you are, can hang your heads in shame and stop frightening your classmates.
All of the base charts come from Prophet.net – an excellent site. I've added the annotation after the fact. As I’ve said before I have an account with them but they don’t know who I am relative to this site – so if you go there don’t bother mentioning me as I get nothing out of it except the knowledge that you are in a great site run by excellent people.
Let’s start with the COMPQ or the NASDAQ chart. Everyone says that in order to have a Bull market tech must lead. That’s just more bull snot. We’ve been in a bull market for almost three years and guess what – small caps led (see RUT chart later) – tech just lollygagged along bringing up the rear. Here is how you know that you are in a full blown Bear market. First you stop looking at daily charts or even weekly charts – for global market direction you need the monthly charts. Second put away your Fibonacci arcs or your Elliot Waves or any other juju you want to use and get a real indicator such as an 8 EMA overlaid on a 21 EMA. Then observe the 8 EMA in relationship to the 21 EMA. See how it flattened out through ‘00 and then rolled over and began converging on the 21 – that’s what I call a pre-Bear market indicator. But the most important thing to notice is that the 8 EMA is some distance away from the 21 EMA (regression to mean guys love this concept) and then it (the EMA 8) flattens and then it converges on the 21. Notice that there is a huge amount of volatility in the bars that are shown in the pre-Bear phase. Then when the 8 EMA finally drops below the 21 EMA we are in a full fledged Bear market. Notice what happens 18 months later. The volatility totally dries up and the 8 EMA turns back up towards the 21 EMA. This is the signal for a pre-Bull market. Six months later the 8 EMA crosses the 21 and off we go again. In this aspect volatility is the excursion from high to low on a monthly basis. Note carefully that I don’t have one bit of volume shown on the charts. That’s because volume might be an indicator of immediate concern (i.e. last 5 minutes or so) but on a large-scale basis it is bogus. If you don’t believe me that’s fine - I’ll do a volume post later this weekend to show you what I’m talking about. If after that you still don’t believe me – well that’s your problem, not mine.
The INDU presents a similar pattern just begins to flatten a lot earlier and rolls over and crosses a lot later. Then when the volatility begins to dry up it finally turns north again (about the same time as the COMPQ) and rolls over up on its way back into Bull territory.

But regardless of the COMPQ and the INDU the real index to watch for a Bull or Bear market is the SPX. Why? Simple – it includes the INDU and the important parts of the COMPQ and is 30% financial and without financial you don’t have a “market”. Notice again the same pattern as seen before – an increase in volatility, a flattening, a roll over, a cross below, a drop, a decrease in volatility, a roll over up and finally a crossing going up. February 2001 to November 2003.
The next chart is the RUT or small cap index. You can discern the same pattern again – an EMA 8 running away from the EMA 21 with increasing volatility – roll over and drop till finally the volatility runs dry and there is another roll over and up it goes. Note carefully that it led us out of the last Bear market – not the tech. In fact tech has gone nowhere in years. Notice the period in ’98-99 where we had a pre-bear – not! No volatility increase is noted. That was a consolidation, nothing more. You see the same effect on all four charts but only the RUT EMA 8 actually touched the EMA 21. What the RUT chart shows you is even if you have a Bear market in the majors you can always find a Bull in the juniors.

Speaking of financials here is the XLF chart. I’ve annotated it but I’m fairly sure that you can see the Bear and Bull market aspects clearly by now. Note that the current period doesn’t seem to be showing any Bear tracks.
Finally I give you the Wilshire 5000. I’m thinking that this index will become the defacto market indicator of the future. It was released just before the last Bear market began which was convenient for this post. The most import fact regarding the 5000 (not just the annotated Bull and Bear aspects) are the four areas I’ve circled and annotated as “summertime”. June, July, August, and September are obviously the flat months over the past 4 years. Interestingly enough it is always in these months that the Bear talk reaches its annual crescendo.

So – with all of those pictures annotated as they are - can anyone see the same pattern appearing currently in any of the three major indices shown? No – very good. How about in the RUT or the XLF or the Wilshire 5000? Still no – excellent. Now why would that be? Everyone who guessed: ‘because we are not in a bear market’; can stay after school and clean the erasers. The rest of you and you know who you are, can hang your heads in shame and stop frightening your classmates.
All of the base charts come from Prophet.net – an excellent site. I've added the annotation after the fact. As I’ve said before I have an account with them but they don’t know who I am relative to this site – so if you go there don’t bother mentioning me as I get nothing out of it except the knowledge that you are in a great site run by excellent people.
Freaky Friday
OK so it isn't an original headline - so what. The market isn't very original either. As in - I've heard this tune before. As in all week long. Interestingly enough I ended the week pretty much exactly where I started only $100 difference and that is to the bad - I lost money this week.
The chop chop chop of a tired market trudging ever so slowly across time has taken its toll on a lot of fortunes this week.
The three sisters all finished the last hour decidedly red but I don't believe anything on a Friday in August. Next week will be worse because it is the Friday before labor day and absolutely no one will be buying or selling stocks much past noon if then.
The up/down ratio sits at 49% and I'll discuss the significance of this in a minute. The new 20 day highs vs lows prints 410 to 335. Remember that below 500 for either one is quite meaningless - things only get exciting when they get up in the over 500 area. The last time that happened was 11 August on the new 20 day lows and we had a mini-boom right after that. Then the last time we had 500+ on the 20 day highs was 4 days ago (trading days) and we've gone down or sideways since.
The 10-day up/down ratio averages around 49 which is about where it should be (50%).
Why would 50% be normal? Because the market generally spends the same amount of time going up as it does going down. I haven't looked at this in awhile but in general over the past 60 years the Dow Industrials have gone up on 52% of the trading days and down on 48% of the days. The average up day has yielded $18.86 and the average down day $18.89.
It is that 3 cents variance on a down day that keeps the average from running away and hiding at some unheard of value - that and the fact that they keep changing the components. If they didn't that 3 cents would probably be $3 or more. One of these days I'm going to run the figures for the SPX. I'll get back to you on that.
If the muse strikes over the rest of the weekend I publish a post regarding recessions and why I don't think we are in one.
The chop chop chop of a tired market trudging ever so slowly across time has taken its toll on a lot of fortunes this week.
The three sisters all finished the last hour decidedly red but I don't believe anything on a Friday in August. Next week will be worse because it is the Friday before labor day and absolutely no one will be buying or selling stocks much past noon if then.
The up/down ratio sits at 49% and I'll discuss the significance of this in a minute. The new 20 day highs vs lows prints 410 to 335. Remember that below 500 for either one is quite meaningless - things only get exciting when they get up in the over 500 area. The last time that happened was 11 August on the new 20 day lows and we had a mini-boom right after that. Then the last time we had 500+ on the 20 day highs was 4 days ago (trading days) and we've gone down or sideways since.
The 10-day up/down ratio averages around 49 which is about where it should be (50%).
Why would 50% be normal? Because the market generally spends the same amount of time going up as it does going down. I haven't looked at this in awhile but in general over the past 60 years the Dow Industrials have gone up on 52% of the trading days and down on 48% of the days. The average up day has yielded $18.86 and the average down day $18.89.
It is that 3 cents variance on a down day that keeps the average from running away and hiding at some unheard of value - that and the fact that they keep changing the components. If they didn't that 3 cents would probably be $3 or more. One of these days I'm going to run the figures for the SPX. I'll get back to you on that.
If the muse strikes over the rest of the weekend I publish a post regarding recessions and why I don't think we are in one.
Wednesday, August 23, 2006
Wacky Wednesday
Wrong again totally different from yesterday - but the market did go down today. NASDAQ had the worst day but the others were also off a bit. I'm looking for some recovery tomorrow. The Up/Down ratio is at 28%, the new 20 highs vs new lows stand at 298 to 362 which is good - means that things are starting to become a bit oversold. The three sisters all finished the day with strong white candles in the last hour and the VIX is within 5% of its 10 day average.
I held a couple of stocks overnight - XMSR and AMD. There really wasn't much going on today as far as day trades are concerned and I am hoping for a jump in both in the early going.
I held a couple of stocks overnight - XMSR and AMD. There really wasn't much going on today as far as day trades are concerned and I am hoping for a jump in both in the early going.
Tuesday, August 22, 2006
Tuesday
Got it wrong again strong start - weak finish. I was looking for the opposite effect. I think tomorrow is set up to be just like today. The VIX is back within 10% of its 10 day moving average but not by much, the up/down ratio is 50% which is an increase from yesterday, the 20 day high/low figures are 551 to 169 and the 551 is just barely above the 500 cutoff. The three sisters finished the last hour with white candles although all three of them were little more than doji. But the previous hours were all strong and as I've pointed out before a doji is just a resting signal and it takes the attributes of the previous candle in most instances - so we could call them strong white final hours of trading.
Good trading all. If I see anything worth watching I'll post it at 10:15 tomorrow.
If not I won't.
Good trading all. If I see anything worth watching I'll post it at 10:15 tomorrow.
If not I won't.
Monday, August 21, 2006
Another Crappy Monday Part Dieux
Well I lied - I didn't make money today - instead I lost it. Started out with FTO and lost 20 cents. Followed that with BRCM and CELL and lost 20 cents on BRCM and 20 cents on CELL. Sounds like a broken record and it is. Fortunately nothing really that bad and with any luck I'll make it up during the week.
But I violated one of my touchstones which is - if there are two red bars in the first three 15-minute bars on the DIA then wait for a confirmation of a turnaround before you trade. I didn't and I lost. It is that simple.
Today was more like a consolidation than anything else. Although it seems hardly possible the volume on both the Q's and the SPY was below Friday's and the DIA's volume wasn't much better than. They all printed a doji or doji like candle for the day. Now the doji doesn't necessarily mean that they are through going up because it is a resting configuration. As I noted over the weekend three gaps usually requires a rest whether it is up or down so the market rested today. That kind of matches my "I don't know" guess from the other day.
The VIX remains 10% off its 10 day moving average but the up/down ratio is 34% which is good - indicates a consolidation taking place. The new 20-day highs vs lows sits at 416 to 176. The 416 number is a good value in that it means that some of the pressure is off but the 176 number still indicates that there is nothing to buy yet i.e. there is no selling of note going on. The DIA printed a strong white candle at the last hour, SPY printed a moderate white and the Q's printed a strong red.
My hunch is that today was a retail scaredy cat day when all the retail buyers started getting out of their little positions for some profits but the institutions remained invested.
So what does all this mean for tomorrow? I could see a weak opening with a strong finish. But I've got a day's worth of personal business so I won't be trading. I'll do a wrap tomorrow night.
But I violated one of my touchstones which is - if there are two red bars in the first three 15-minute bars on the DIA then wait for a confirmation of a turnaround before you trade. I didn't and I lost. It is that simple.
Today was more like a consolidation than anything else. Although it seems hardly possible the volume on both the Q's and the SPY was below Friday's and the DIA's volume wasn't much better than. They all printed a doji or doji like candle for the day. Now the doji doesn't necessarily mean that they are through going up because it is a resting configuration. As I noted over the weekend three gaps usually requires a rest whether it is up or down so the market rested today. That kind of matches my "I don't know" guess from the other day.
The VIX remains 10% off its 10 day moving average but the up/down ratio is 34% which is good - indicates a consolidation taking place. The new 20-day highs vs lows sits at 416 to 176. The 416 number is a good value in that it means that some of the pressure is off but the 176 number still indicates that there is nothing to buy yet i.e. there is no selling of note going on. The DIA printed a strong white candle at the last hour, SPY printed a moderate white and the Q's printed a strong red.
My hunch is that today was a retail scaredy cat day when all the retail buyers started getting out of their little positions for some profits but the institutions remained invested.
So what does all this mean for tomorrow? I could see a weak opening with a strong finish. But I've got a day's worth of personal business so I won't be trading. I'll do a wrap tomorrow night.
Saturday, August 19, 2006
Christmas is Coming
And so is Monday.
If I guess down every day I will be right quite frequently so I'm going to guess I don't know for Monday. Same tired tune - the VIX is massively below its 10 day average now (3 days past 10%) and while I have seen it go lower for a longer period - not much lower nor much longer. Here is the VIX from last June. You can see that the last 70 days or so have been extremely volatile (relative to its 10 day moving average) than any other time in the past year. I don't know what that means I just find it interesting and I'm sure we'll find out what it means eventually. Maybe, as with so many other indicators, absolutely nothing.
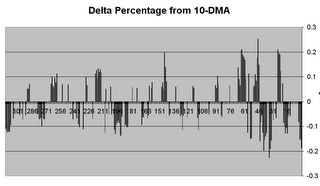
For purposes of illustration any plot less than +/- 5% is left off the chart. I'm not interested in anything but the extremes and approaching the extremes.
Meanwhile the Up/Down ratio sits at a benign 50%. This is a good sign as it suggest that a consolidation is taking place right under our noses and we aren't seeing it. That's because the new 20 day highs still sits at a massive 818 while the new 20 day lows sits at 182. Remember that 500+ in either direction is an overweight and requires some adjustment. Well the adjustment is taking place because today's reading is less than yesterdays. It doesn't have to be an abrupt change.
Then the DIA and the SPY both finished the last hour with a strong white candles and the Q's printed a doji. While many people consider a doji to be a reversal indicator (which it is many times) I consider it as a resting indicator and actually a continuation of the last candle. So that would make it a strong white too because the previous hour was strong white.
But we might have a gap down open on Monday (well it is Monday and what would Monday be without another gap down open - wait I know - Tuesday) and that is OK because many of my strongest plays have come from gap downs.
One thing I don't usually bother with is volume but the volume on Friday was very weak and that is a contrary indicator. It suggests that the shorts were all done covering on Thursday. Which makes sense because generally the third gap up open which is what happened Thursday scares the hell out of the shorts and they cover so there were no shorts left on Friday. So since the pro's all went to the beach at noon most of the buying Friday afternoon was retail trade and we know what that means - they're going to get crushed.
Well I'm flat and you can't crush money markets so even though I don't know what's going to happen on Monday I'm pretty sure of one thing - if I trade I'll make money.
More about that later.
If I guess down every day I will be right quite frequently so I'm going to guess I don't know for Monday. Same tired tune - the VIX is massively below its 10 day average now (3 days past 10%) and while I have seen it go lower for a longer period - not much lower nor much longer. Here is the VIX from last June. You can see that the last 70 days or so have been extremely volatile (relative to its 10 day moving average) than any other time in the past year. I don't know what that means I just find it interesting and I'm sure we'll find out what it means eventually. Maybe, as with so many other indicators, absolutely nothing.

For purposes of illustration any plot less than +/- 5% is left off the chart. I'm not interested in anything but the extremes and approaching the extremes.
Meanwhile the Up/Down ratio sits at a benign 50%. This is a good sign as it suggest that a consolidation is taking place right under our noses and we aren't seeing it. That's because the new 20 day highs still sits at a massive 818 while the new 20 day lows sits at 182. Remember that 500+ in either direction is an overweight and requires some adjustment. Well the adjustment is taking place because today's reading is less than yesterdays. It doesn't have to be an abrupt change.
Then the DIA and the SPY both finished the last hour with a strong white candles and the Q's printed a doji. While many people consider a doji to be a reversal indicator (which it is many times) I consider it as a resting indicator and actually a continuation of the last candle. So that would make it a strong white too because the previous hour was strong white.
But we might have a gap down open on Monday (well it is Monday and what would Monday be without another gap down open - wait I know - Tuesday) and that is OK because many of my strongest plays have come from gap downs.
One thing I don't usually bother with is volume but the volume on Friday was very weak and that is a contrary indicator. It suggests that the shorts were all done covering on Thursday. Which makes sense because generally the third gap up open which is what happened Thursday scares the hell out of the shorts and they cover so there were no shorts left on Friday. So since the pro's all went to the beach at noon most of the buying Friday afternoon was retail trade and we know what that means - they're going to get crushed.
Well I'm flat and you can't crush money markets so even though I don't know what's going to happen on Monday I'm pretty sure of one thing - if I trade I'll make money.
More about that later.
Friday, August 18, 2006
Friday
Somedays like today you sit around all day watching paint dry and then all of a sudden in the last hour it hands you a buck - last hour,Friday here's a buck enjoy your weekend. And so I will.
Grabbed MRK this A.M. at 39.65 and it slowly crawled its way up to 39 and minichange by 2 P.M. I figure oh well it's a small profit and I've got nowhere to go let's hold it till 3:30 at least unless it backs up from here. Next thing I know its chugging and I slap a sell on it on its way back from 39.75 and catch a buck even. Somedays all you have to do is show up.
I had a couple of others but nothing of note and I sold them both off for a little change over break even. They were NKTR and ATHR (which I hate but it looked good this morning for a bit). I would have done OK on either or both of them if I had been patient. But I didn't like the way the market was shaping up so I figured one position would be enough if it went to hell.
I'll be back later this weekend with my predictions for next week and some other odds and ends. Now remember rule 1 - nobody knows nothing and you will understand clearly where this week came from.
Grabbed MRK this A.M. at 39.65 and it slowly crawled its way up to 39 and minichange by 2 P.M. I figure oh well it's a small profit and I've got nowhere to go let's hold it till 3:30 at least unless it backs up from here. Next thing I know its chugging and I slap a sell on it on its way back from 39.75 and catch a buck even. Somedays all you have to do is show up.
I had a couple of others but nothing of note and I sold them both off for a little change over break even. They were NKTR and ATHR (which I hate but it looked good this morning for a bit). I would have done OK on either or both of them if I had been patient. But I didn't like the way the market was shaping up so I figured one position would be enough if it went to hell.
I'll be back later this weekend with my predictions for next week and some other odds and ends. Now remember rule 1 - nobody knows nothing and you will understand clearly where this week came from.
Thursday, August 17, 2006
Thursday
Well that wasn't down but it wasn't exactly a resounding up day either. The VIX still stays way under its 10 day average the DIA finished the last hour red but the Q's and the SPY finished with strong white candles. A perfect way to go into expiration day - confused. The up/down ratio is a benign 49% and the new 20 day high vs low sits at 994 to 174 - still not very much out there to buy.
Gold resolved its problem and fell off the edge of the earth. And now it appears to be way, way oversold. In anticipation of a new run I took a smallish position in BGO which I am still holding. I will probably hold it over the weekend and sell on Monday.
Trading wise I took a position in HOV and broke even on the trade (including commission) and made a little on AMD.
Not a great day since I had to attend a funeral this afternoon. An old friend simply ran out of time but he was around for a bit. He made the landing at D-Day, fathered 9 children, and stayed married to the same woman for over 60 years. And I doubt he owned a share of stock in his entire life. Bless him - he will be missed.
Gold resolved its problem and fell off the edge of the earth. And now it appears to be way, way oversold. In anticipation of a new run I took a smallish position in BGO which I am still holding. I will probably hold it over the weekend and sell on Monday.
Trading wise I took a position in HOV and broke even on the trade (including commission) and made a little on AMD.
Not a great day since I had to attend a funeral this afternoon. An old friend simply ran out of time but he was around for a bit. He made the landing at D-Day, fathered 9 children, and stayed married to the same woman for over 60 years. And I doubt he owned a share of stock in his entire life. Bless him - he will be missed.
Watch Lists
I don't publish watch lists because I trade gap downs or gap ups almost exclusively. So until about 9:45 I haven't a clue what I might be trading that day and I generally do not take a trade until 10:00 or until after the market settles down. Many times I won't take a trade until I see the first three 15 minute bars of the DIA. The first three bars set the tone of the market for the day and I trade accordingly.
I learned long ago that I have no business trading in the first 30 minutes but I will sell an overnight holding in that time period if the price is right. (The price is always right because I won't hold an overnight holding beyond 9:40 or so).
I learned long ago that I have no business trading in the first 30 minutes but I will sell an overnight holding in that time period if the price is right. (The price is always right because I won't hold an overnight holding beyond 9:40 or so).
Gold Speaks And No One Listens
As my reader (thanks Mom) has noticed I use candlesticks in my trading. There are reasons for this and the most important is the fact that the ‘sticks talk to me better than any other method I have found. I am at a point with the candlesticks that I very seldom have to identify patterns – I just know what the next period will bring based on the configuration of the last several periods. As pointed out in www.candlestickforum.com there are very few patterns that you need to know and once you know those you can pretty much trade using candlesticks.
Which leads me to today’s object lesson – commodity prices reflect reality. This is the gold chart (GLD) as of yesterday’s close (8 16).
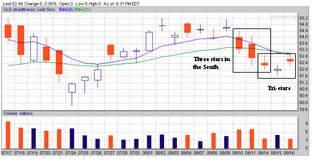
What we see beginning 5 days ago is the classic 3 stars in the South formation which normally precedes a reversal. Then we have a reversal candle (white) that occurred off a gap down and went absolutely nowhere followed yesterday by a gap up that closed lower than its open. To add to the mystery the last three days form a (loose interpretation) tri-star configuration. The tri-star is normally associated with massive confusion which I think is fair. The market as a whole is confused. And why is it confused?
When inflation data shows that inflation is increasing is it still good news if it is below expectations?
Isn’t that the silliest thing you have ever read? If that gets stuck in your head about 10 days from now you are probably going to explode. Sorry. But the people who buy stocks don’t seem to think so. They seem to think that in the face of massive fuel cost increases everything is going to be just fine. Profits are going to soar and soar and we need to bid up prices right away as high as we can.
Me, I’m going to watch gold prices. If gold starts going up again I’m going to start worrying. But I won’t be worried about my investments because as usual – I’ll be flat at 4.
(Disclaimer – I don’t own gold for investment purposes nor do I hold any gold or gold related shares).
The chart comes from prophet.net – an excellent site.
Which leads me to today’s object lesson – commodity prices reflect reality. This is the gold chart (GLD) as of yesterday’s close (8 16).
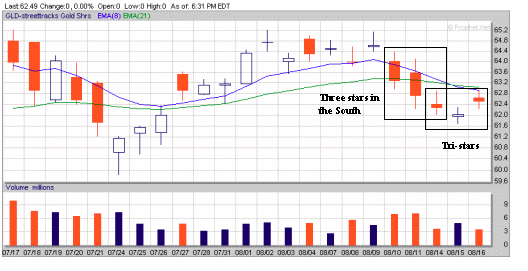
What we see beginning 5 days ago is the classic 3 stars in the South formation which normally precedes a reversal. Then we have a reversal candle (white) that occurred off a gap down and went absolutely nowhere followed yesterday by a gap up that closed lower than its open. To add to the mystery the last three days form a (loose interpretation) tri-star configuration. The tri-star is normally associated with massive confusion which I think is fair. The market as a whole is confused. And why is it confused?
When inflation data shows that inflation is increasing is it still good news if it is below expectations?
Isn’t that the silliest thing you have ever read? If that gets stuck in your head about 10 days from now you are probably going to explode. Sorry. But the people who buy stocks don’t seem to think so. They seem to think that in the face of massive fuel cost increases everything is going to be just fine. Profits are going to soar and soar and we need to bid up prices right away as high as we can.
Me, I’m going to watch gold prices. If gold starts going up again I’m going to start worrying. But I won’t be worried about my investments because as usual – I’ll be flat at 4.
(Disclaimer – I don’t own gold for investment purposes nor do I hold any gold or gold related shares).
The chart comes from prophet.net – an excellent site.
Subscribe to:
Posts (Atom)
